Taranker.Com Logo
VortexIQ Insights logo

VortexIQ Insights

Develop by VortexIQ

$500-$750

/ Month

Streamline e-commerce data into clear, actionable insights for improved performance.

Simple dashboard
Performance metrics
Trend tracking
Streamline data
Filter insights
Data chat

About VortexIQ Insights

Launched Apr 02, 2025

Categories

Built by VortexIQ

Address

Unit 1, Lincoln House, GWQ, Great West Road, Brentford, ENG, TW8 0GE, GB
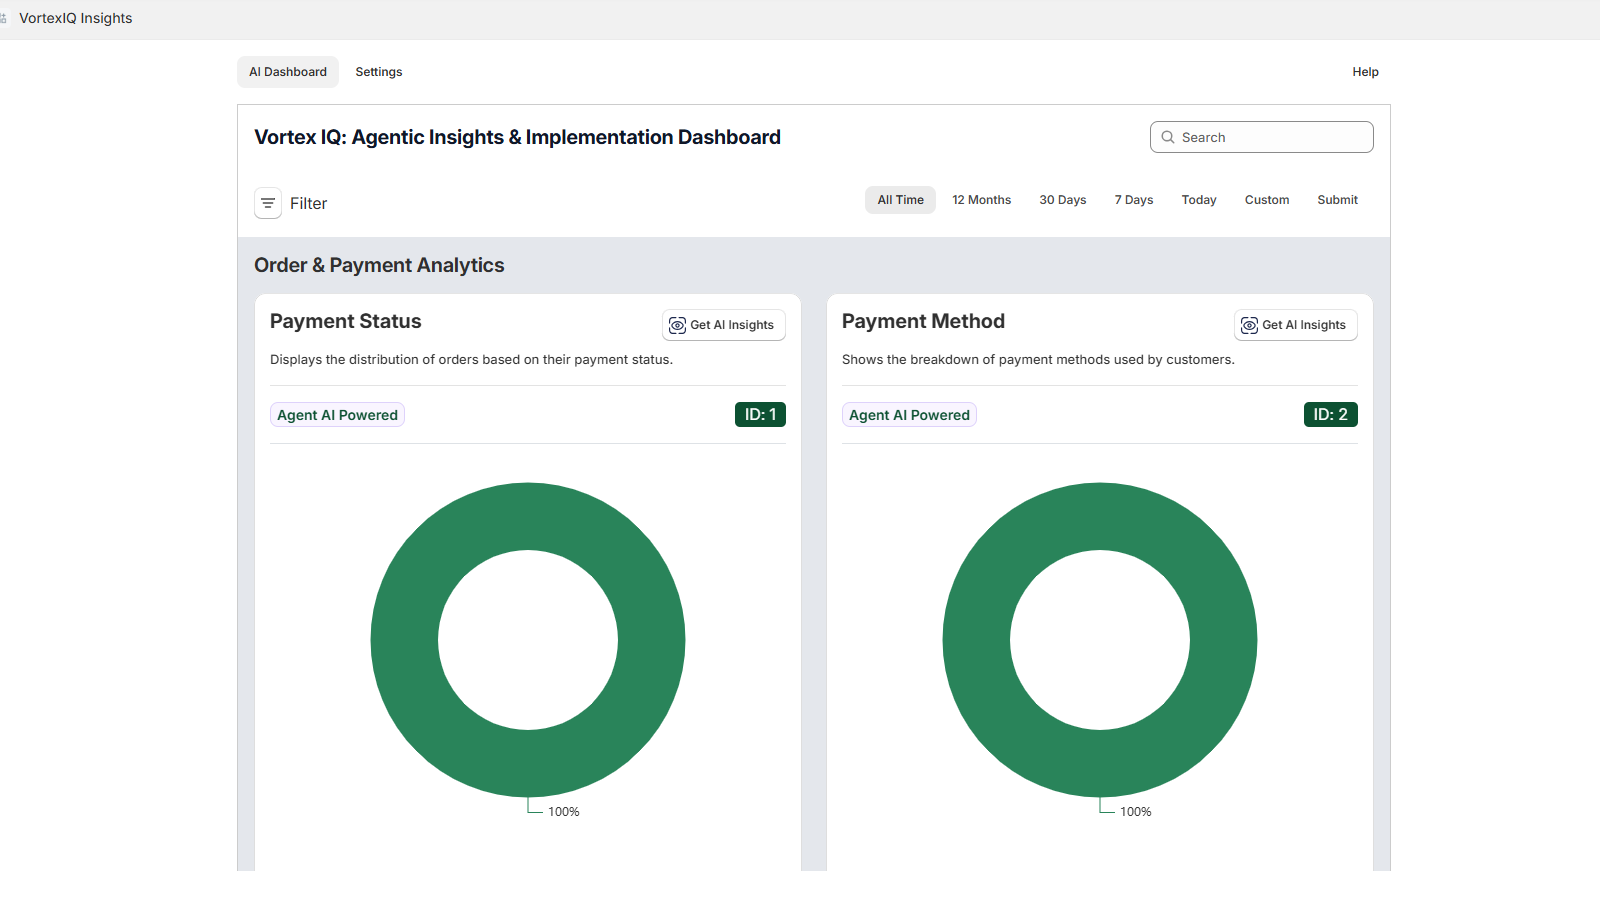
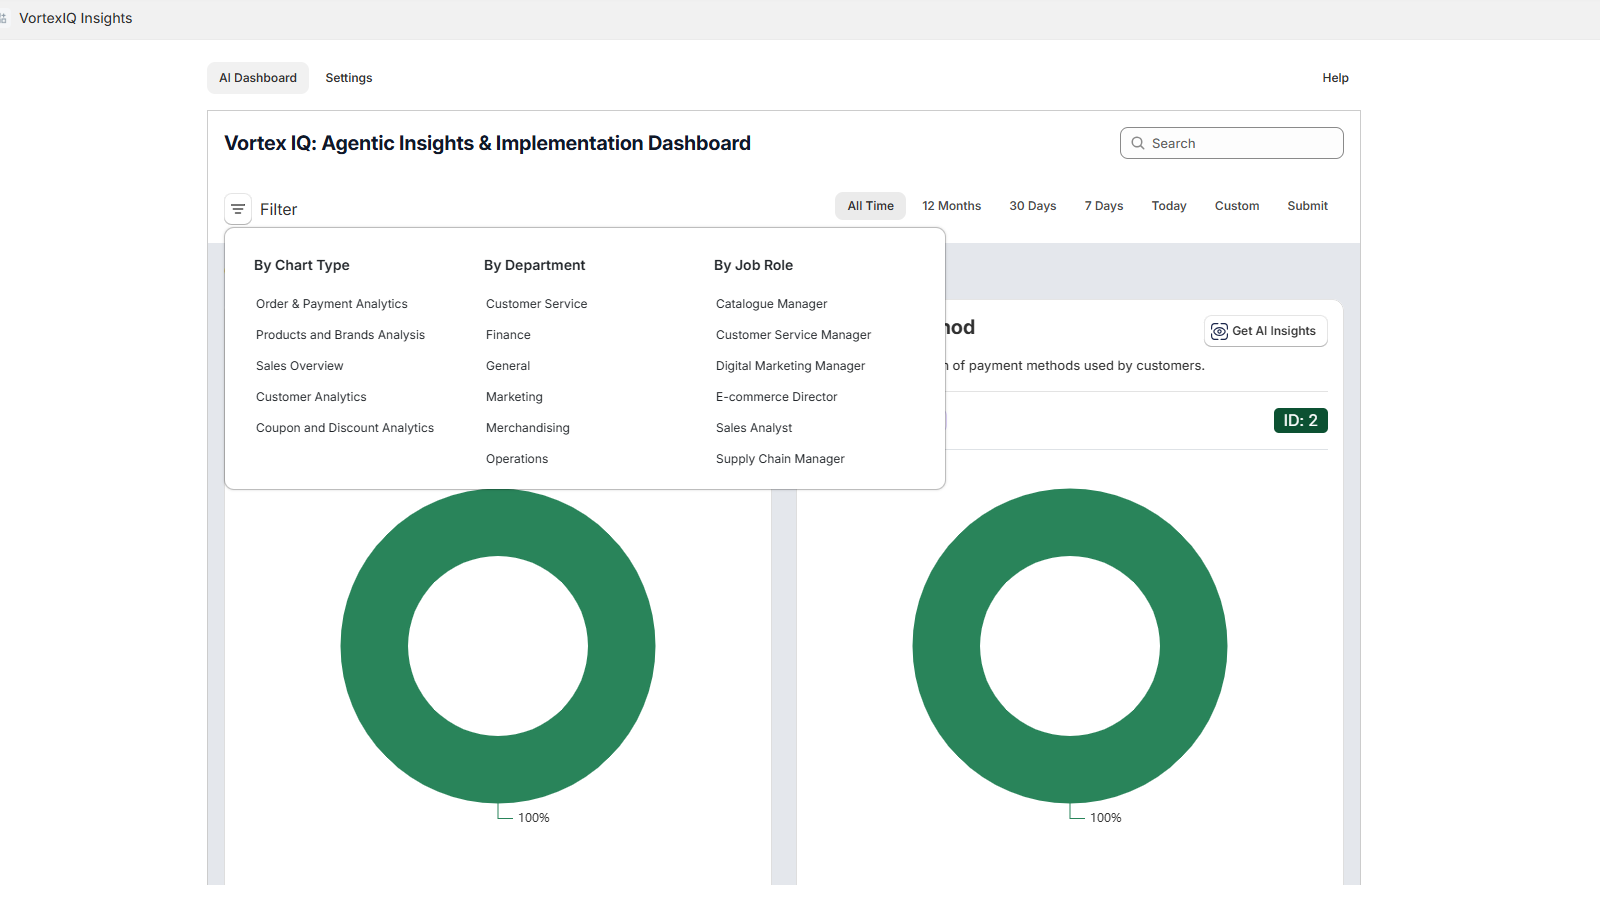
Website Privacy policy
Synctrack Order Tracking logo
(71 Reviews)
  • Sponsored

All-in-1 Order Tracker with a Branded Order Tracking Page

Description

Help merchants harness AI to turn data into actionable insights that improve sales and efficiency.

Vortex IQ helps merchants turn overwhelming e-commerce data into clear, actionable insights. It brings together performance metrics across orders, customers, products, marketing, and more—no need to switch between tools or dig through spreadsheets. Filter charts by chart type, department, or job role, and track trends over time (e.g. 7 days, 30 days, or all time). Easily spot what's working and what needs attention to improve sales, efficiency, and customer experience.

Vortex IQ helps merchants turn overwhelming e-commerce data into clear, actionable insights. It brings together performance metrics across orders, customers, products, marketing, and more—no need to switch between tools or dig through spreadsheets. Filter charts by chart type, department, or job role, and track trends over time (e.g. 7 days, 30 days, or all time). Easily spot what's working and what needs attention to improve sales, efficiency, and customer experience. more
  • Filter insights by role, department, or chart type.
  • All your key store analytics in one simple dashboard.
  • View performance by day, week, month, or custom dates.
  • Chat with your data to uncover insights and next steps.
  • No setup needed—plug in and see your store’s data in minutes.

Pros

  • Streamlines e-commerce data into actionable insights.
  • Combines performance metrics across various segments like orders, customers, and marketing.
  • Eliminates the need to switch between tools or spreadsheets.
  • Offers filtering options by chart type, department, or job role.
  • Enables tracking of trends over different time frames (7 days, 30 days, all time).
  • Provides a consolidated dashboard for key store analytics.
  • Allows user interaction with data through chat for deeper insights.
  • Quick setup with immediate data visibility.

Cons

  • Limited information on customization options for advanced users.
  • Dependent on the app’s ability to integrate seamlessly with various e-commerce platforms.
  • Potential challenges in handling large volumes of data efficiently.

More App like this

Data Export IO: Reports logo
(1,853 Reviews)
$7-$35 / Month
  • Free Plan Available
  • Verified

Easy premade and custom reports: filter, schedule, and more....

Lucky Orange Heatmaps & Replay logo
(831 Reviews)
$19-$89 / Month
  • Free Plan Available

One click install for visual cart and checkout analytics

Convbox Analytics logo
(38 Reviews)
$299-$799 / Month
  • 15 Days Free Trial

Sync Multi Pixels for FB Conversion API & Google Ads...

RealtimeStack : Live Analytics logo
(52 Reviews)
$9-$39 / Month
  • Free Plan Available

Get visual real time insights into what happens in your...

Scroll to Top