Where Knowledge Meets Innovation
Analyse sales, profit and more with interactive dashboards
Launched Oct 17, 2021
Categories
Leona Czarlińskiego 19, Torun, 87-100, PL
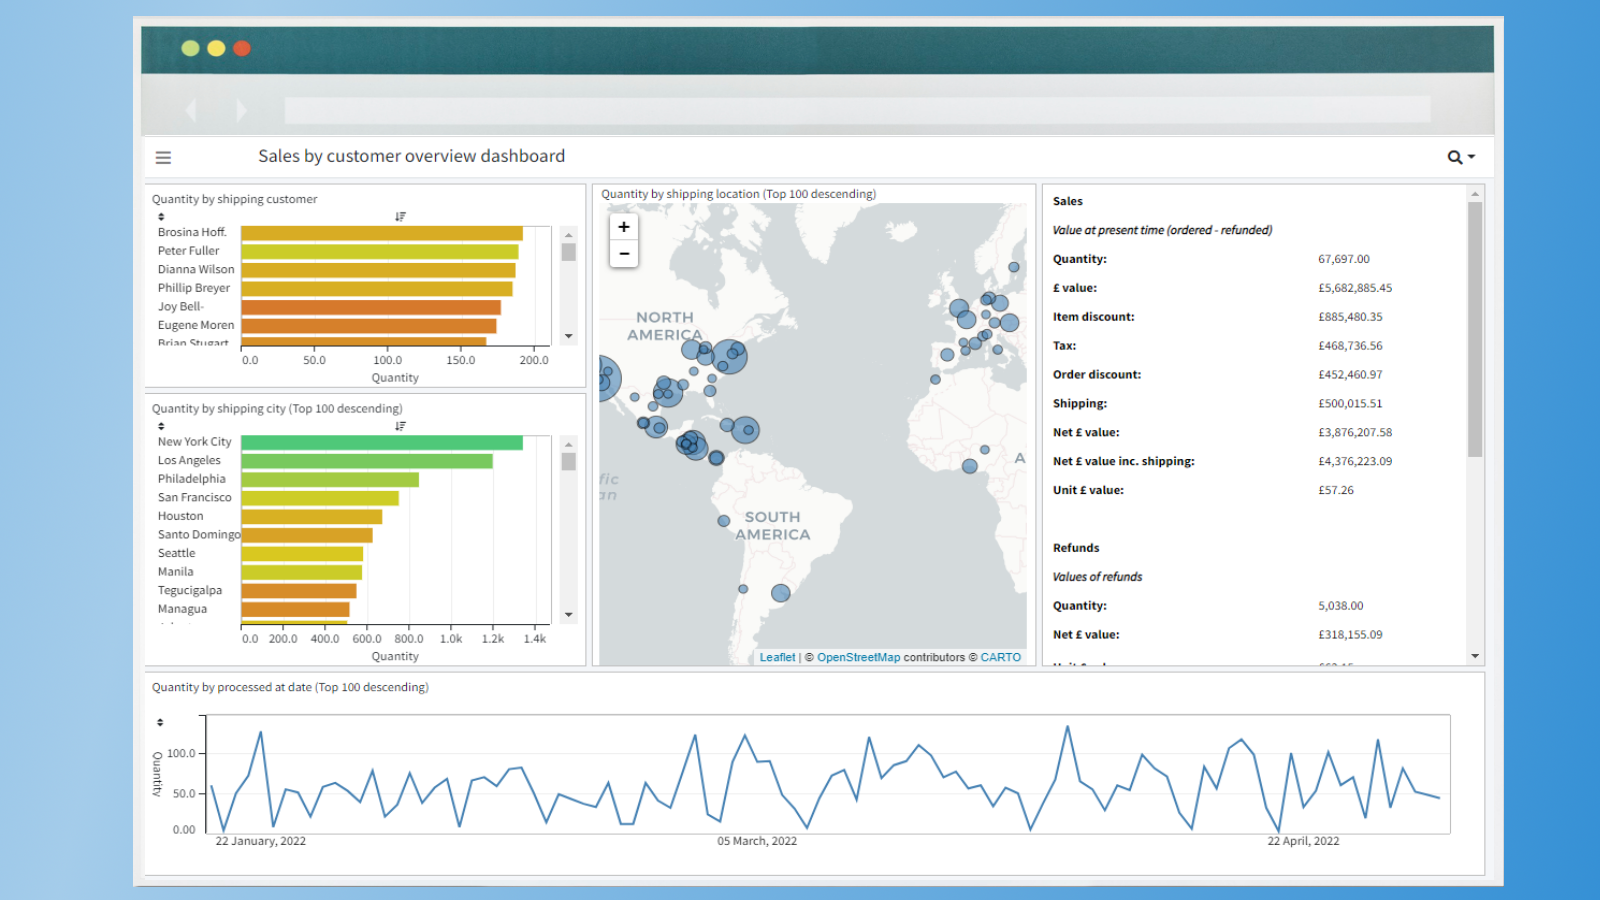
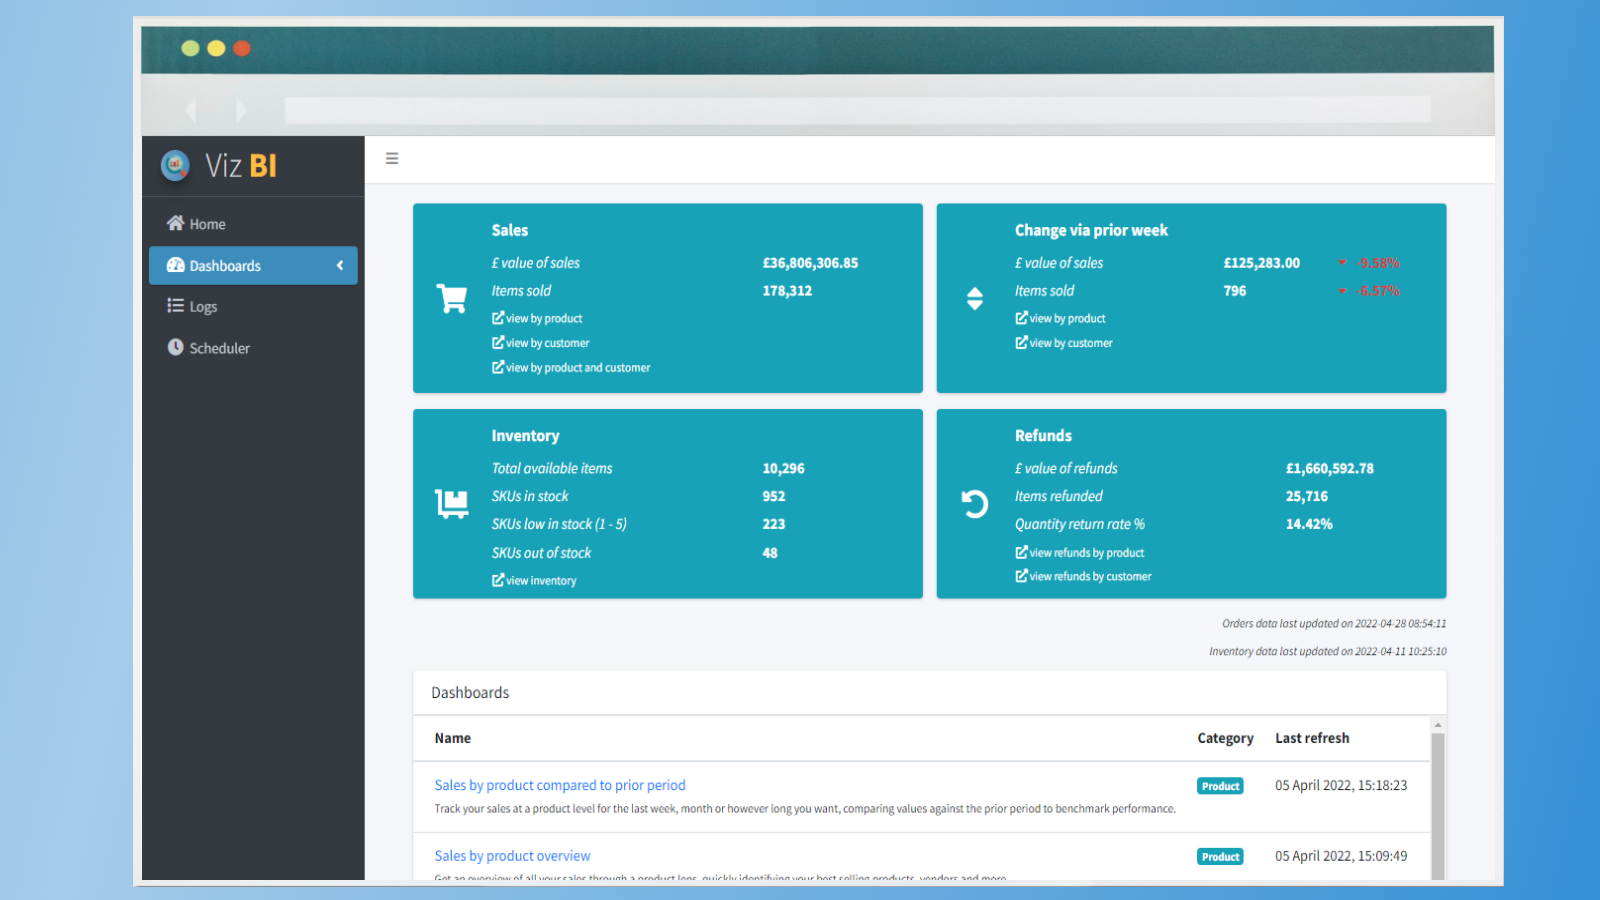
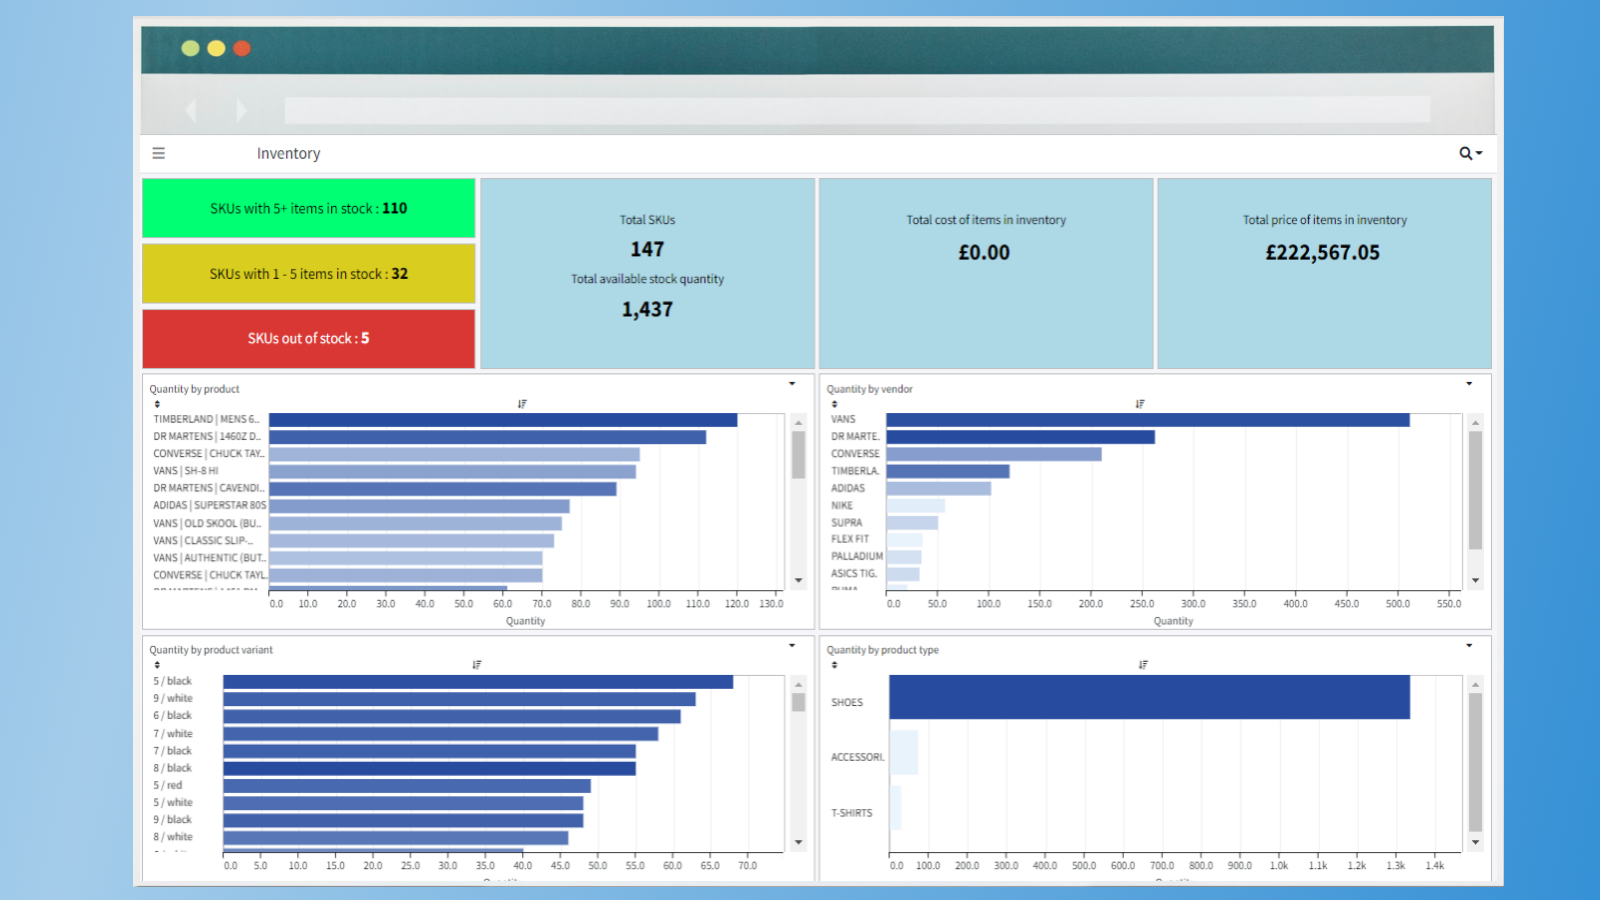
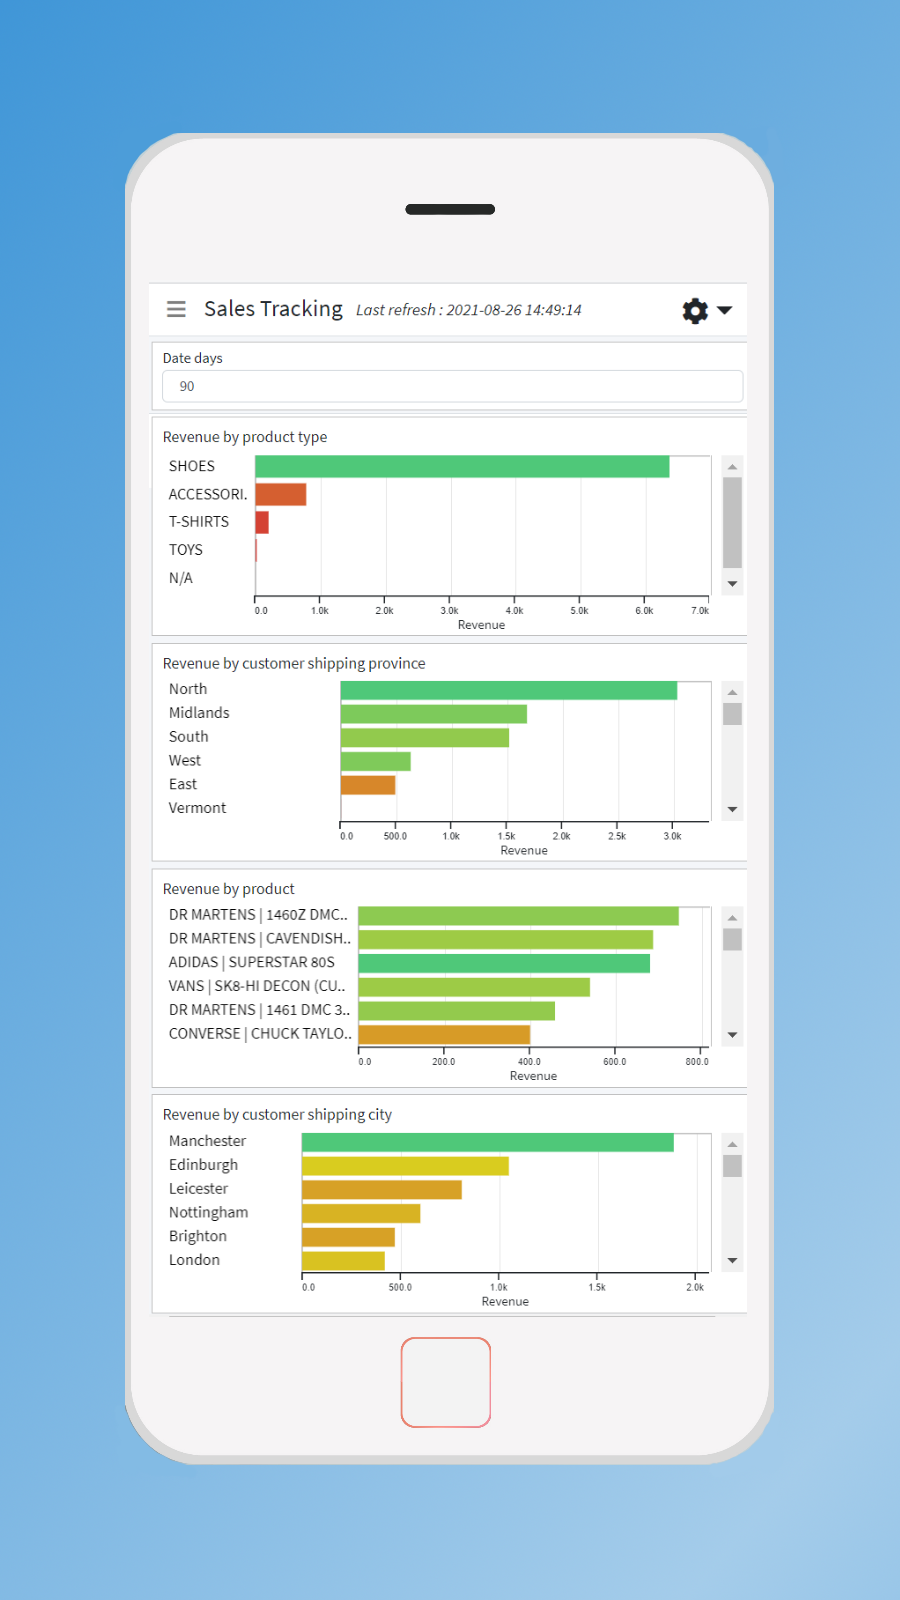
Website Support Portal Privacy policy Tutorial FAQ DocumentViz BI takes your store data - orders, products, customers and more - and transforms it into interactive, easy to understand charts. These charts are then combined into dashboards, providing you with a full picture of your stores performance across a whole range of attributes. Within a matter of clicks you can : • follow which products are trending and which are falling • identify problem items that keep being returned • keep check of inventory, ensuring top sellers are always available
Order fulfillment, Inventory, Pick List, SKU & Barcode...
Multi store Dashboard, Advanced Reports, Audiences, Exports....
Know your profit & LTV with analytics tailored for D2C...
Track TikTok Pixel, Facebook Pixel, Conversion API, Multipixel...