Where Knowledge Meets Innovation
Analyse sales, profit and more with interactive dashboards
Launched Oct 17, 2021
Categories
151 O’Connor St, Ottawa, ON, ON, CA
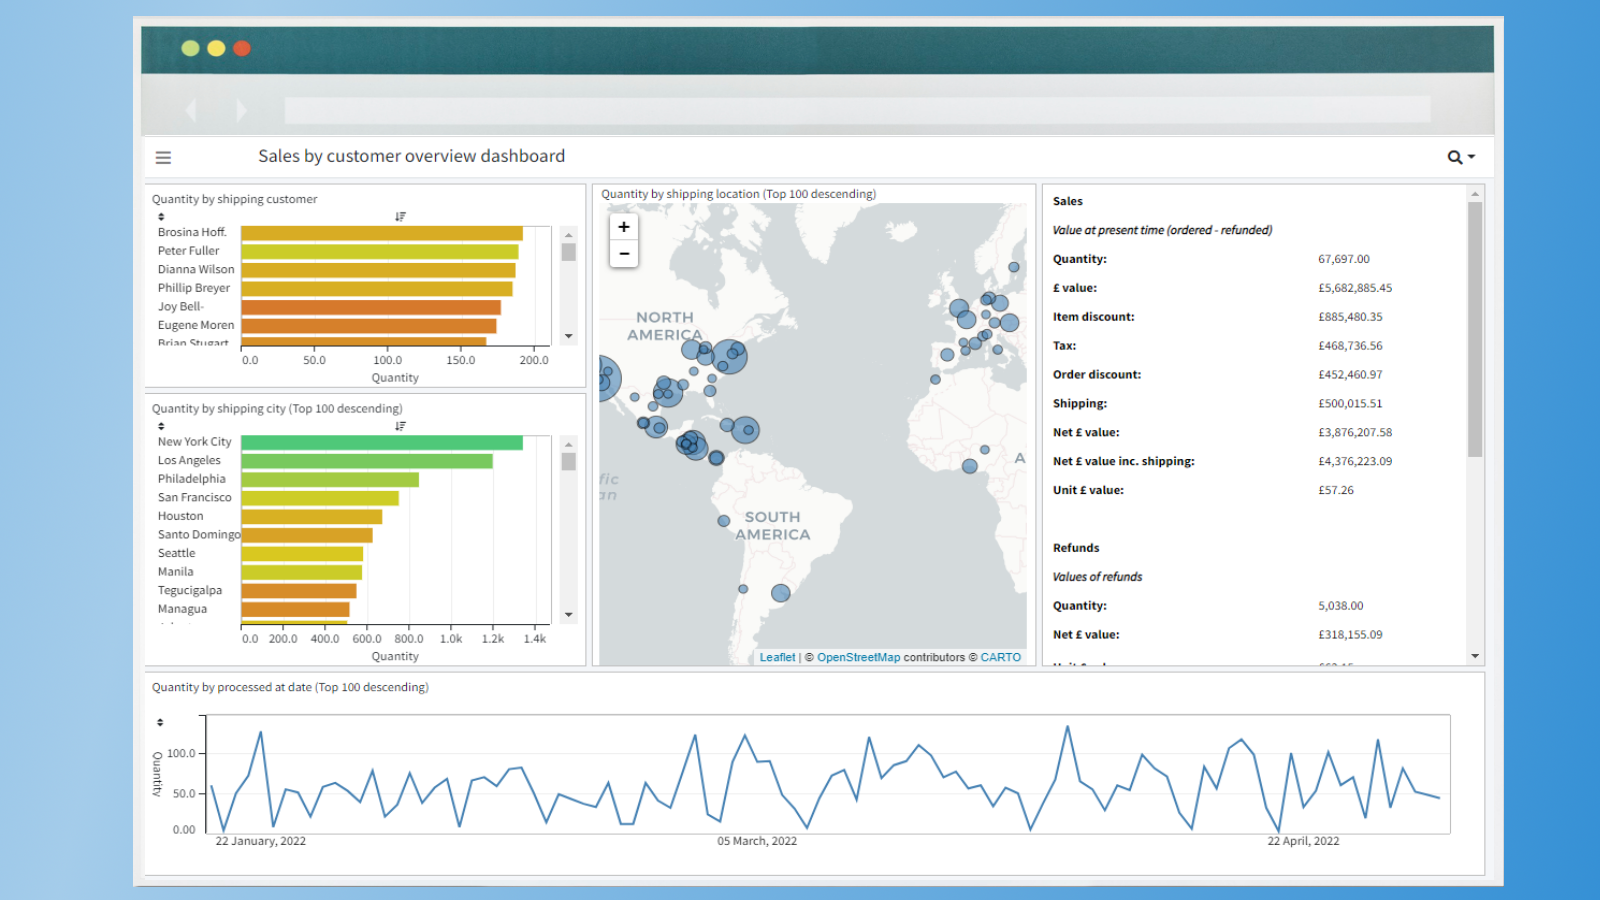
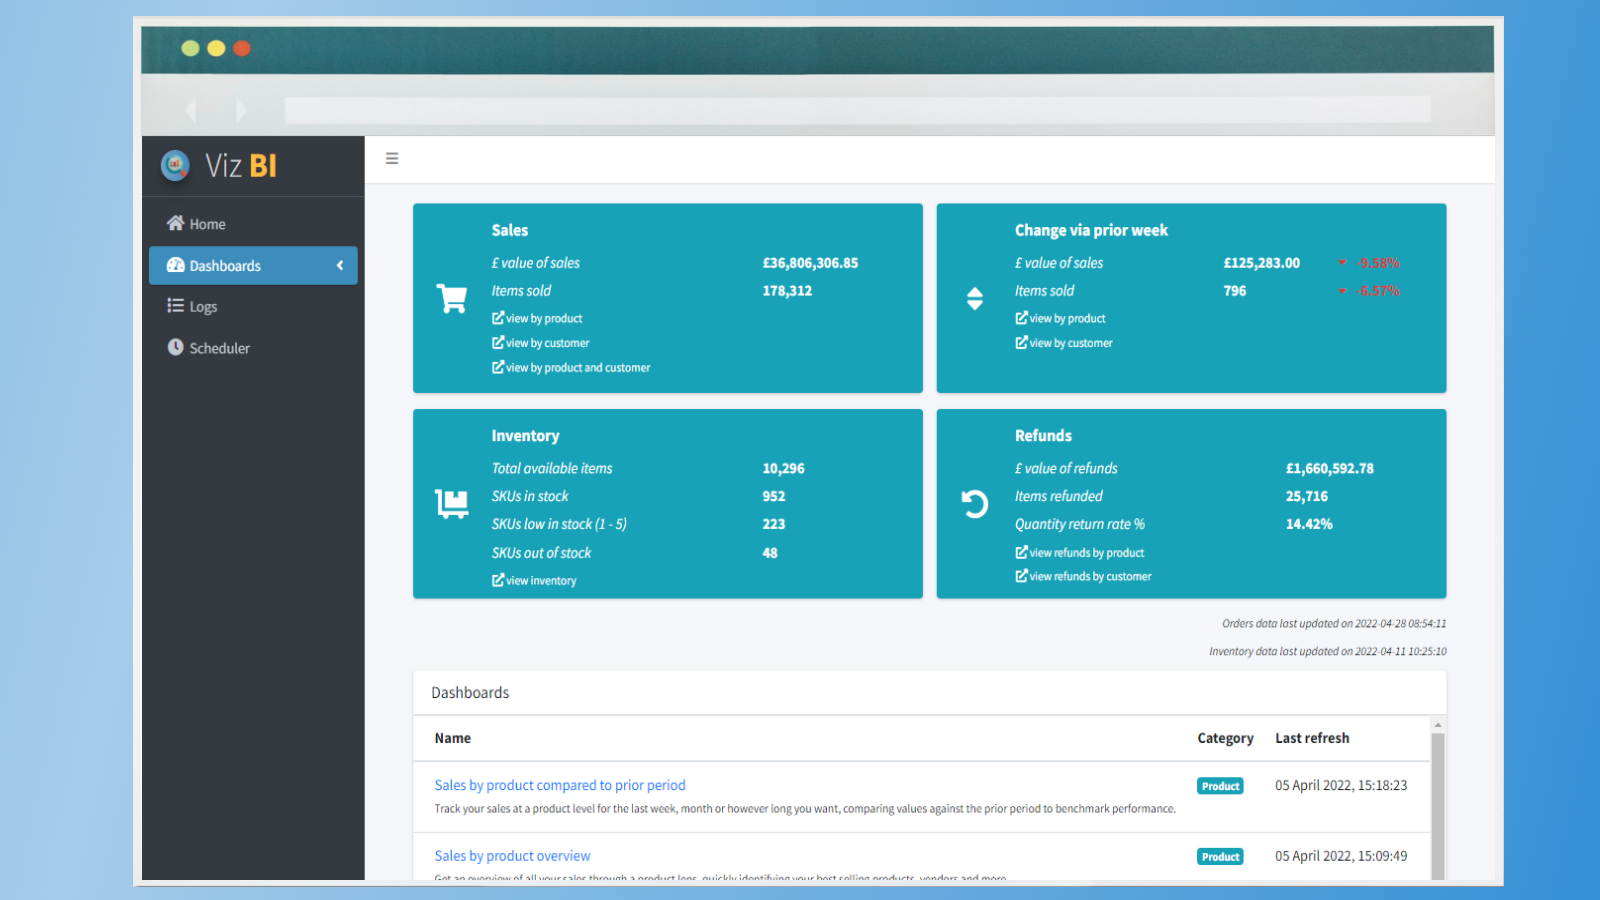
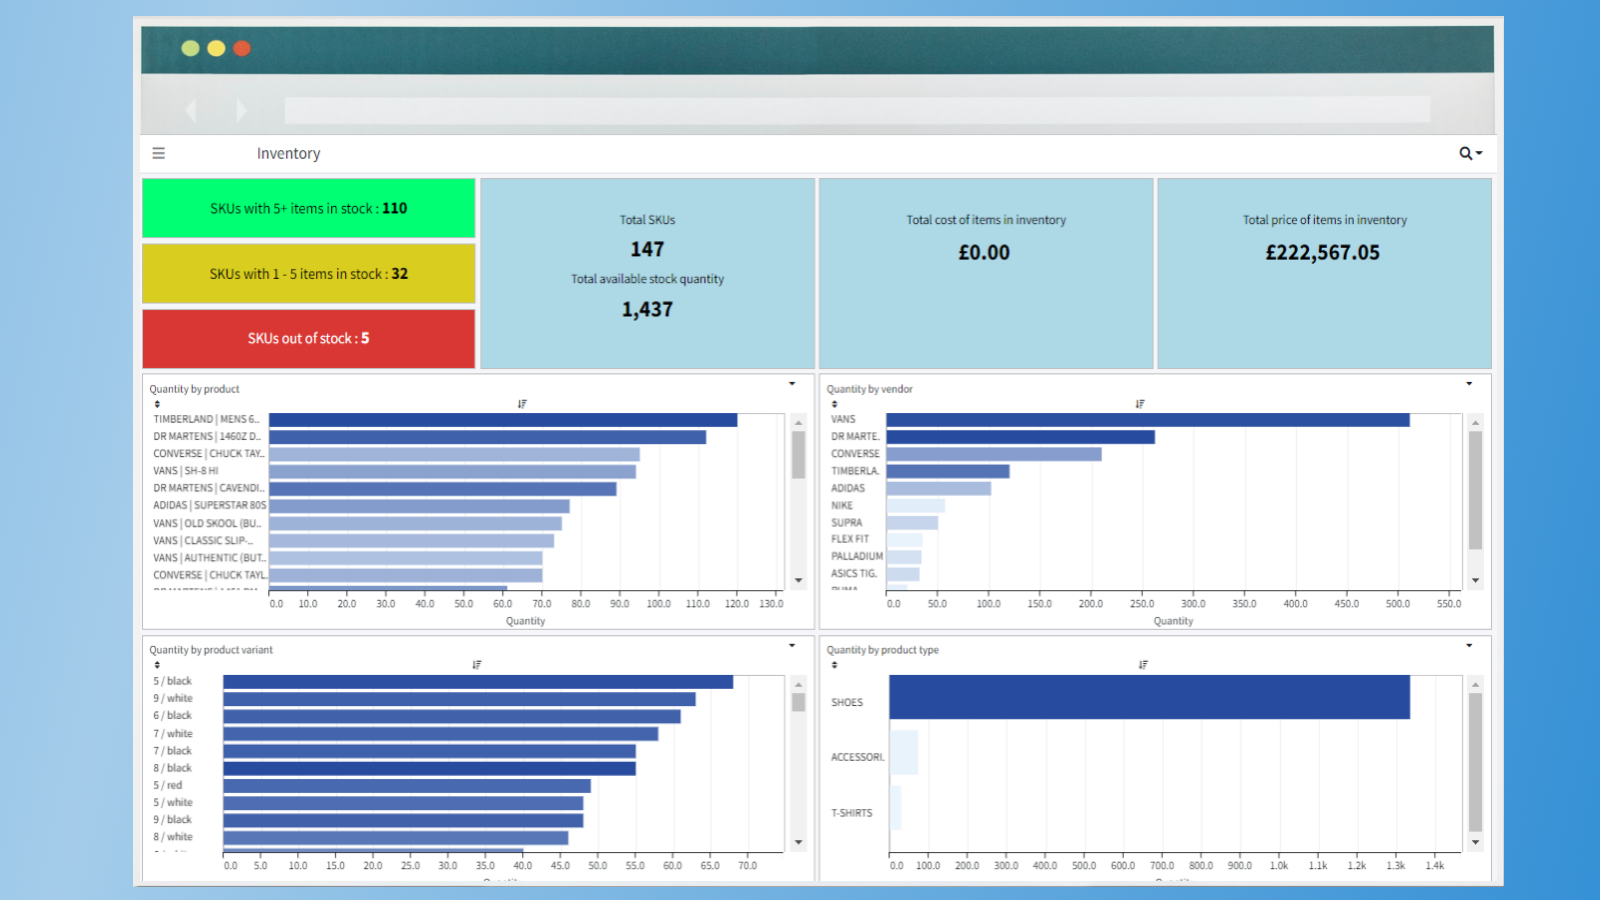
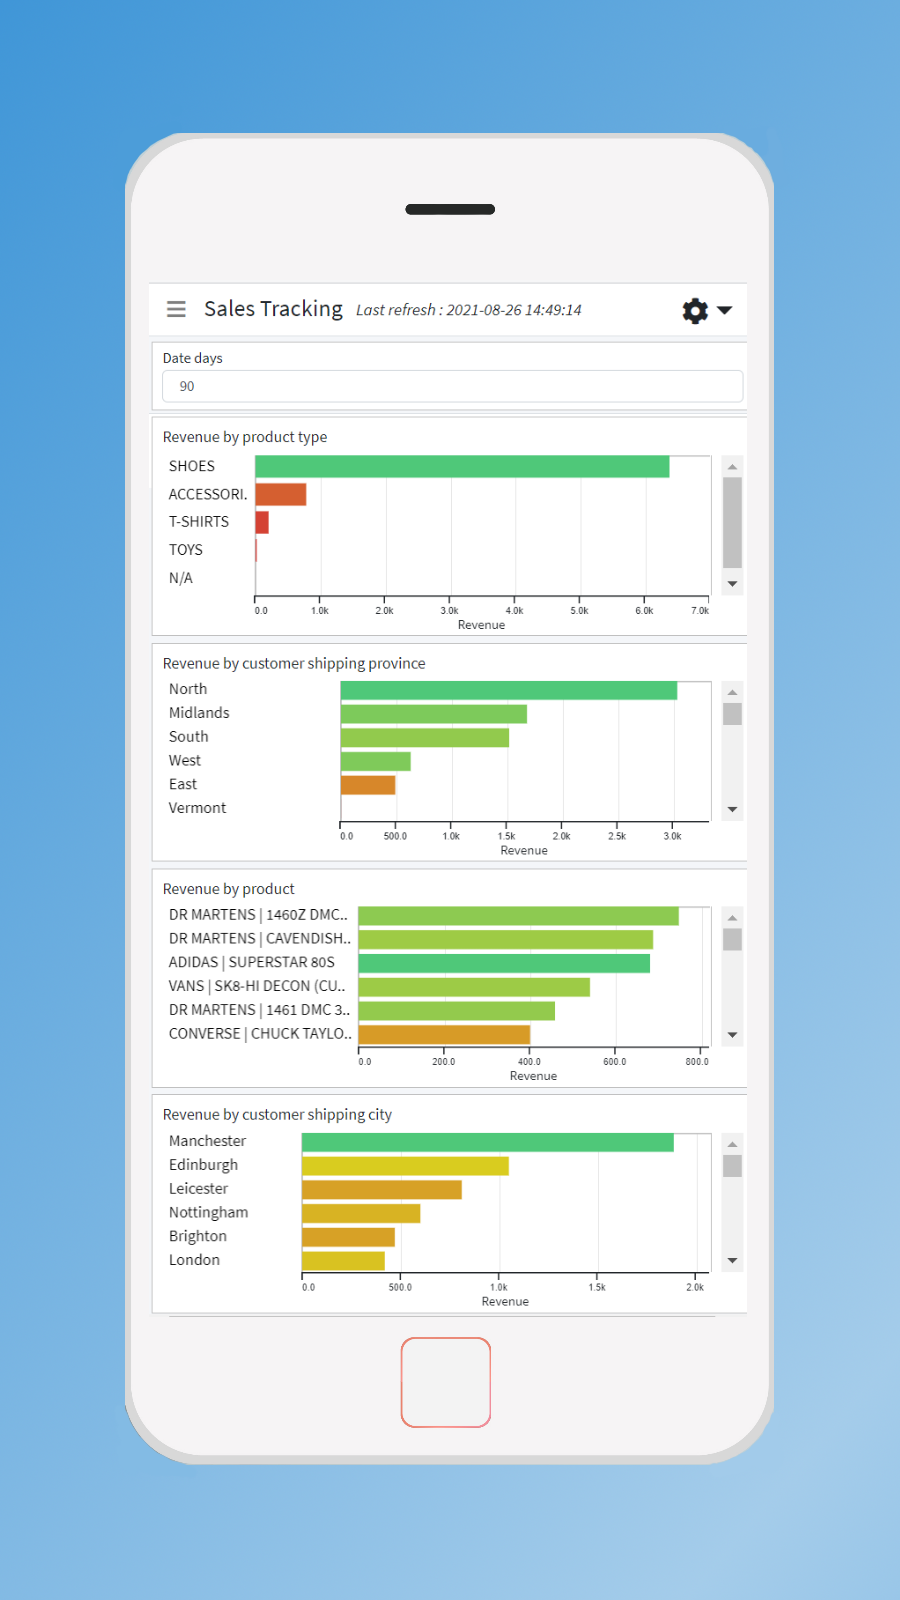
Website Support Portal Privacy policy Tutorial FAQ DocumentViz BI takes your store data - orders, products, customers and more - and transforms it into interactive, easy to understand charts. These charts are then combined into dashboards, providing you with a full picture of your stores performance across a whole range of attributes. Within a matter of clicks you can : • follow which products are trending and which are falling • identify problem items that keep being returned • keep check of inventory, ensuring top sellers are always available
"AI assistant for Shopify: insights, planning, and control...
"Automates reorder forecasting directly in Shopify, enhancing...
Unlock true profitability insights for Shopify stores with...
Monitor store performance and profit with centralized analytics...