Where Knowledge Meets Innovation
Optimize sales with PortfoLytix: Visualize, analyze, and strategize effortlessly.
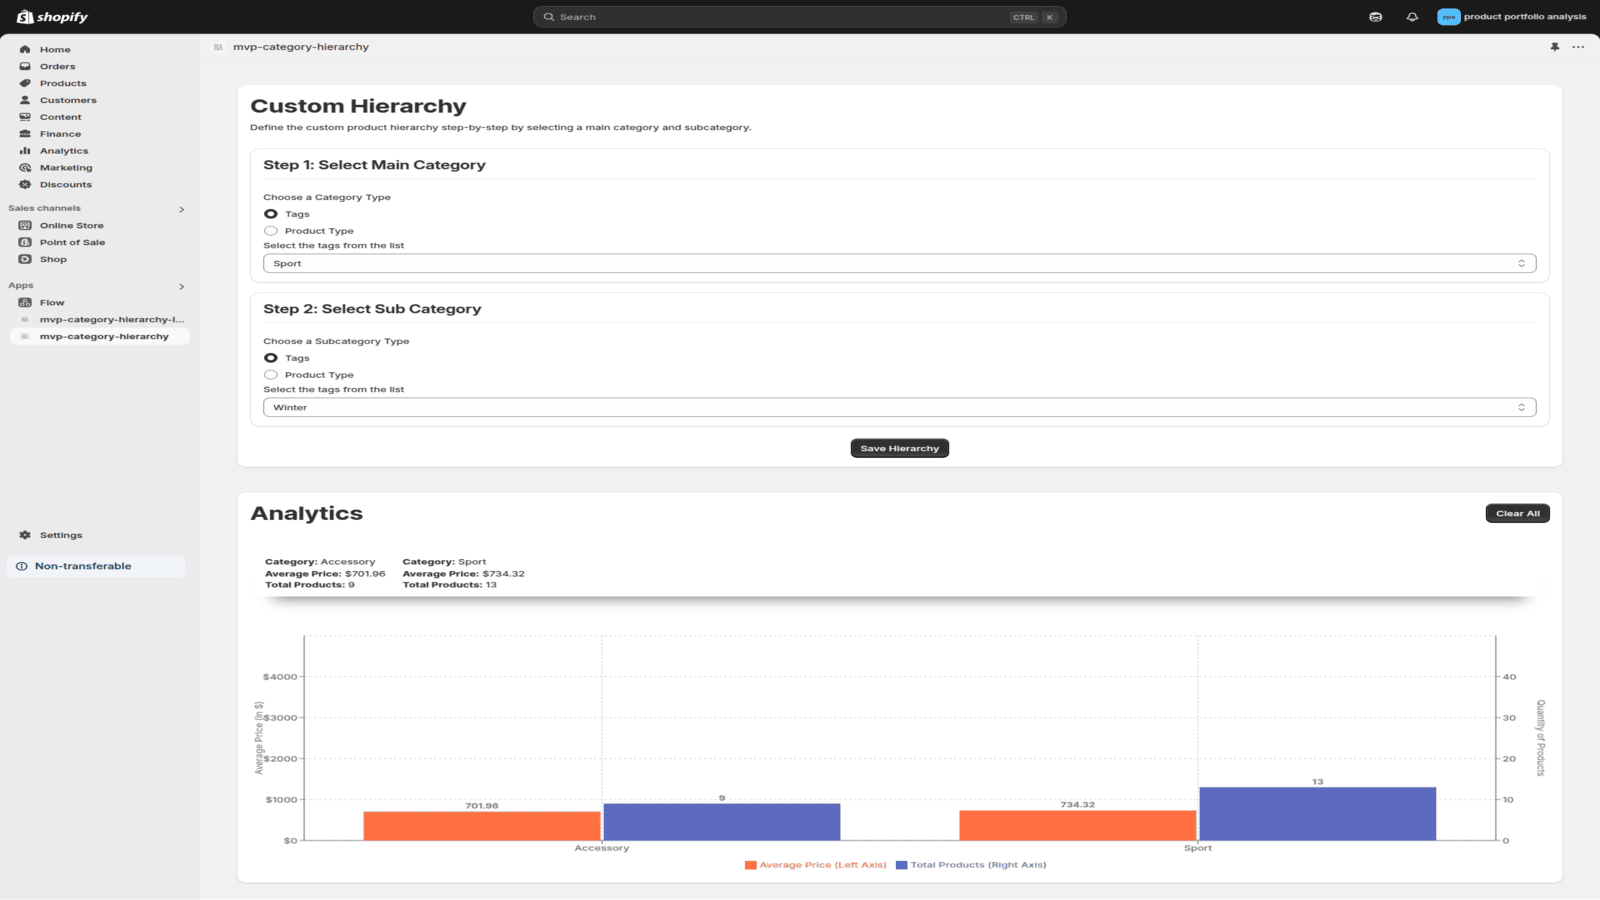
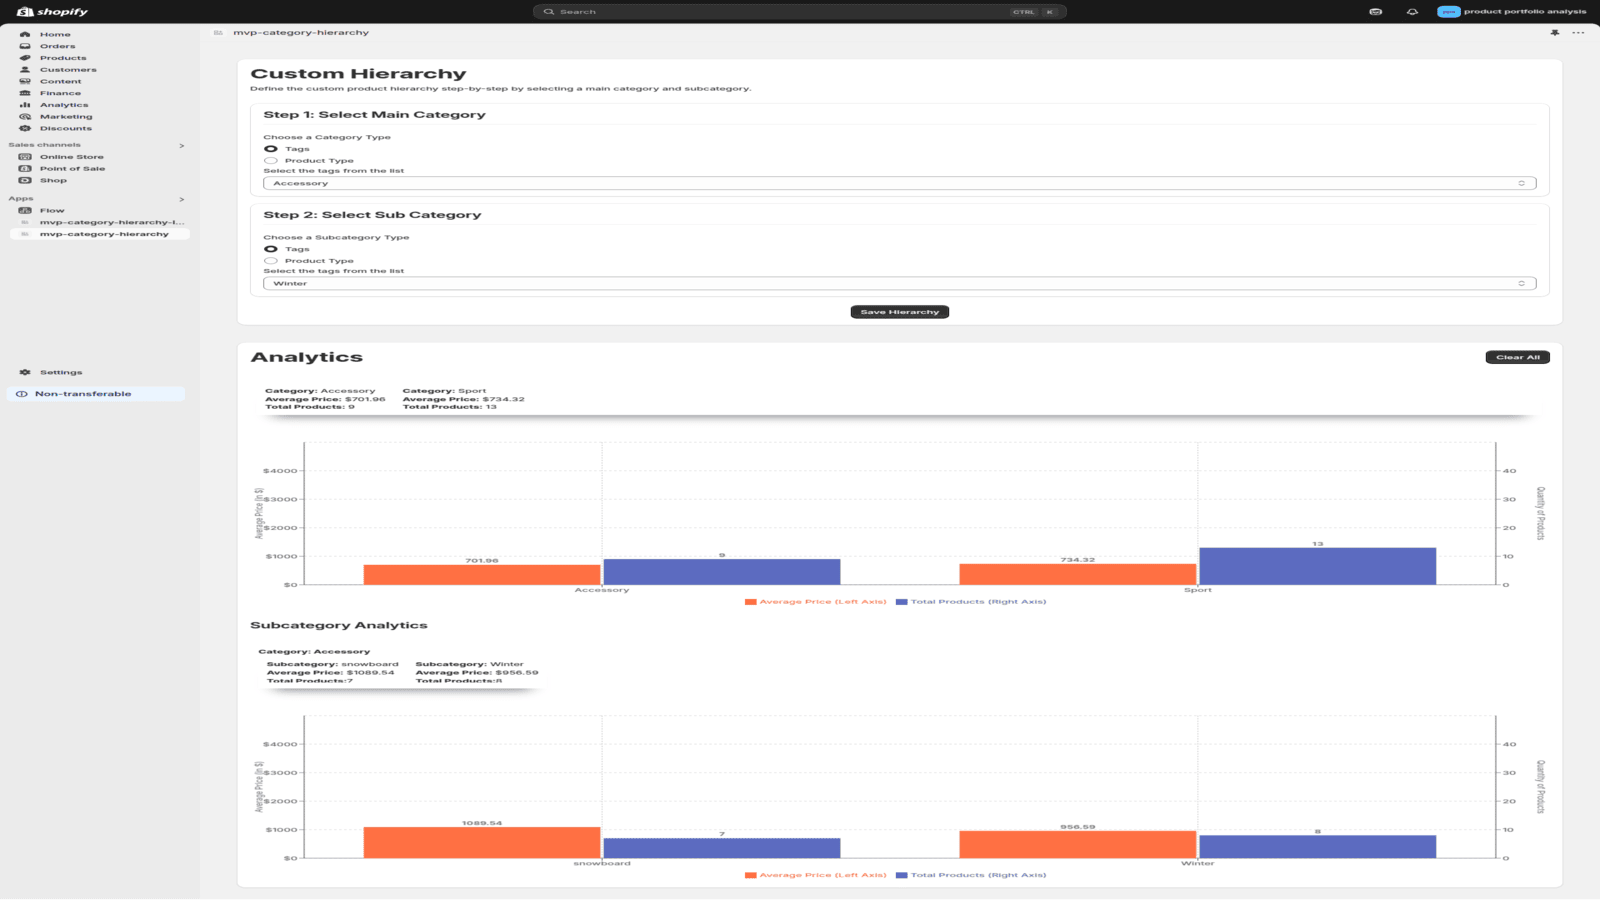
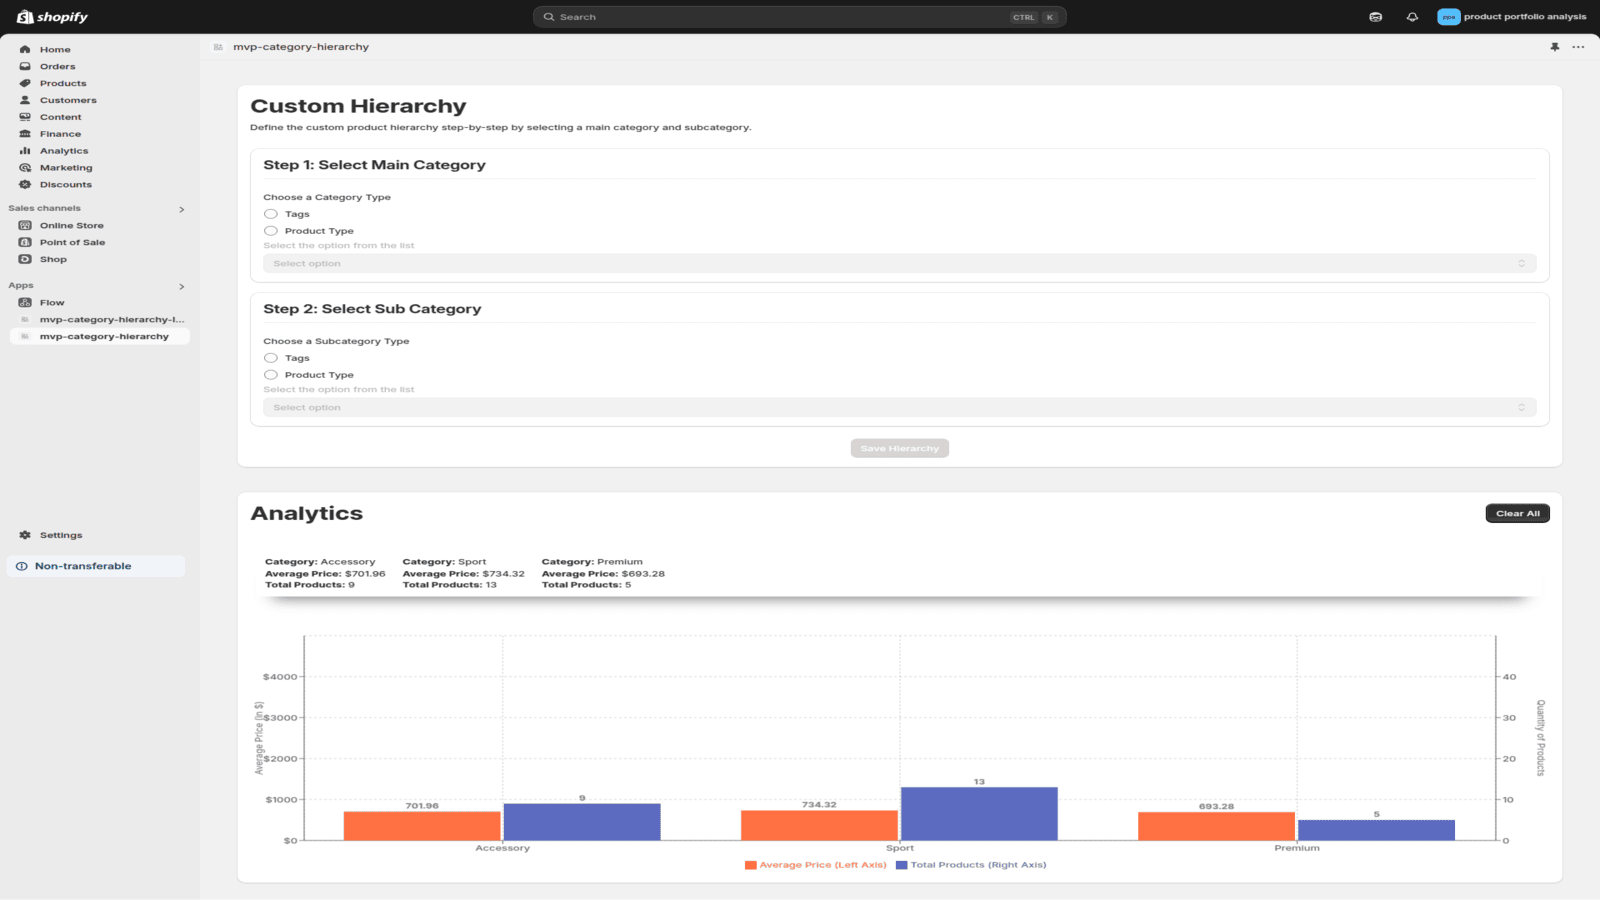
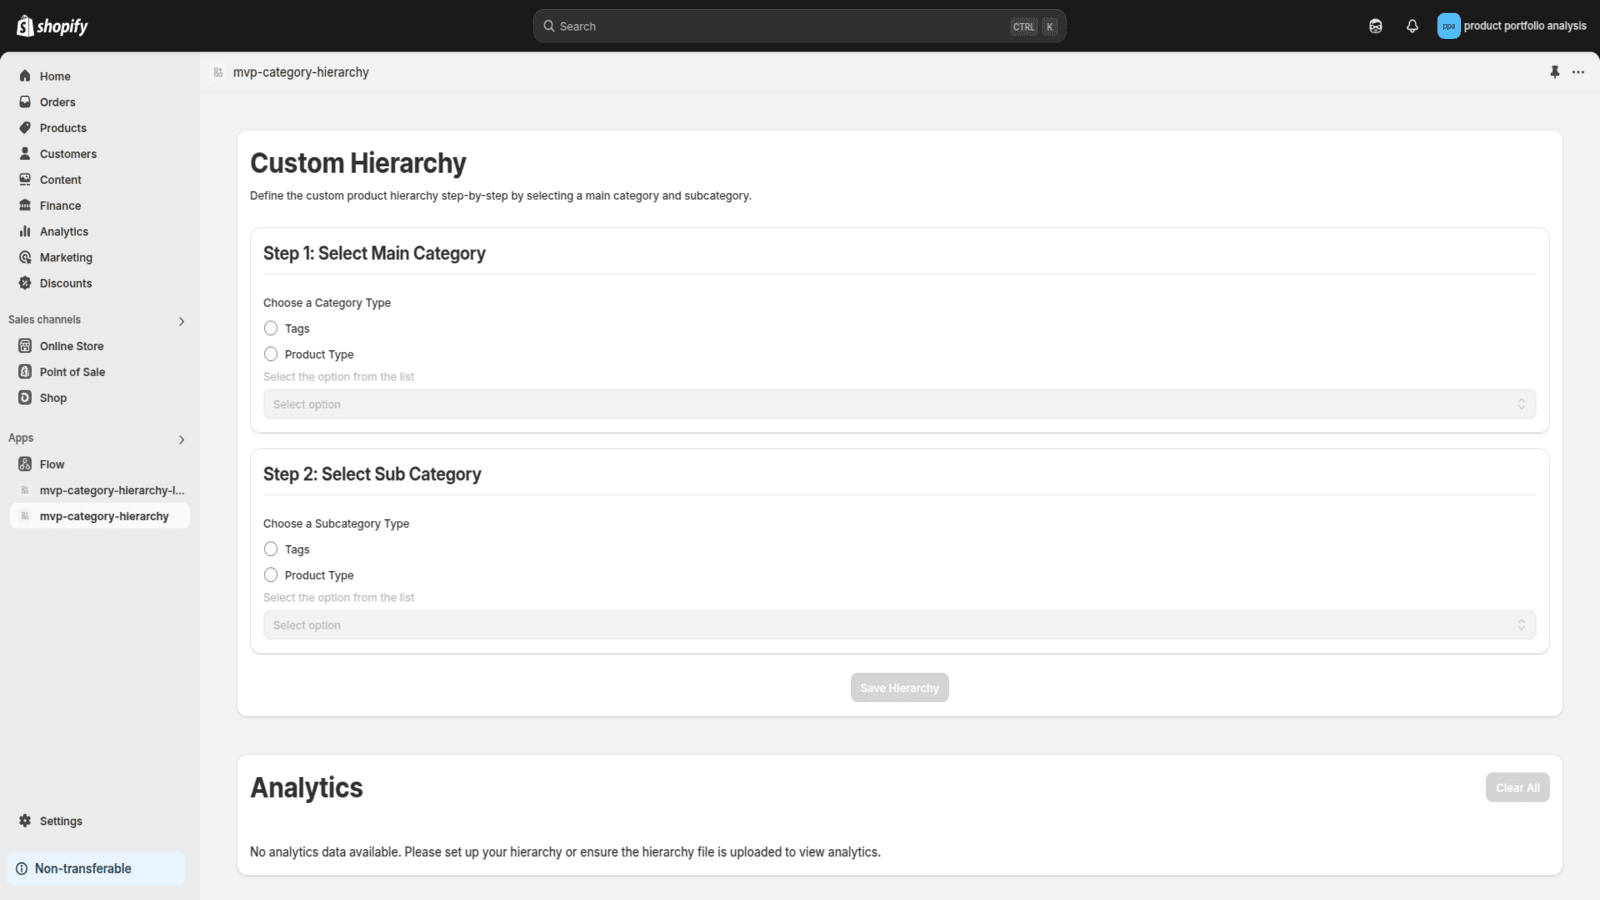
Stop guessing what sells. Portfolytics shows where your sales come from - and where you’re wasting inventory. Instantly see which collections, tags, and categories convert, and where to cut or expand. Navigate your product hierarchy to spot winners and underperformers. Compare product counts vs sales across segments. Visualize sales and product variety at each category level. Designed to be intuitive - but we’re here if you need help.
Product, Price, and Page AB Testing to increase conversions...
Scale TikTok Ads easily with Multi TikTok Pixels & Tiktok...
UTM-based tracking and reporting to give you clarity