Where Knowledge Meets Innovation
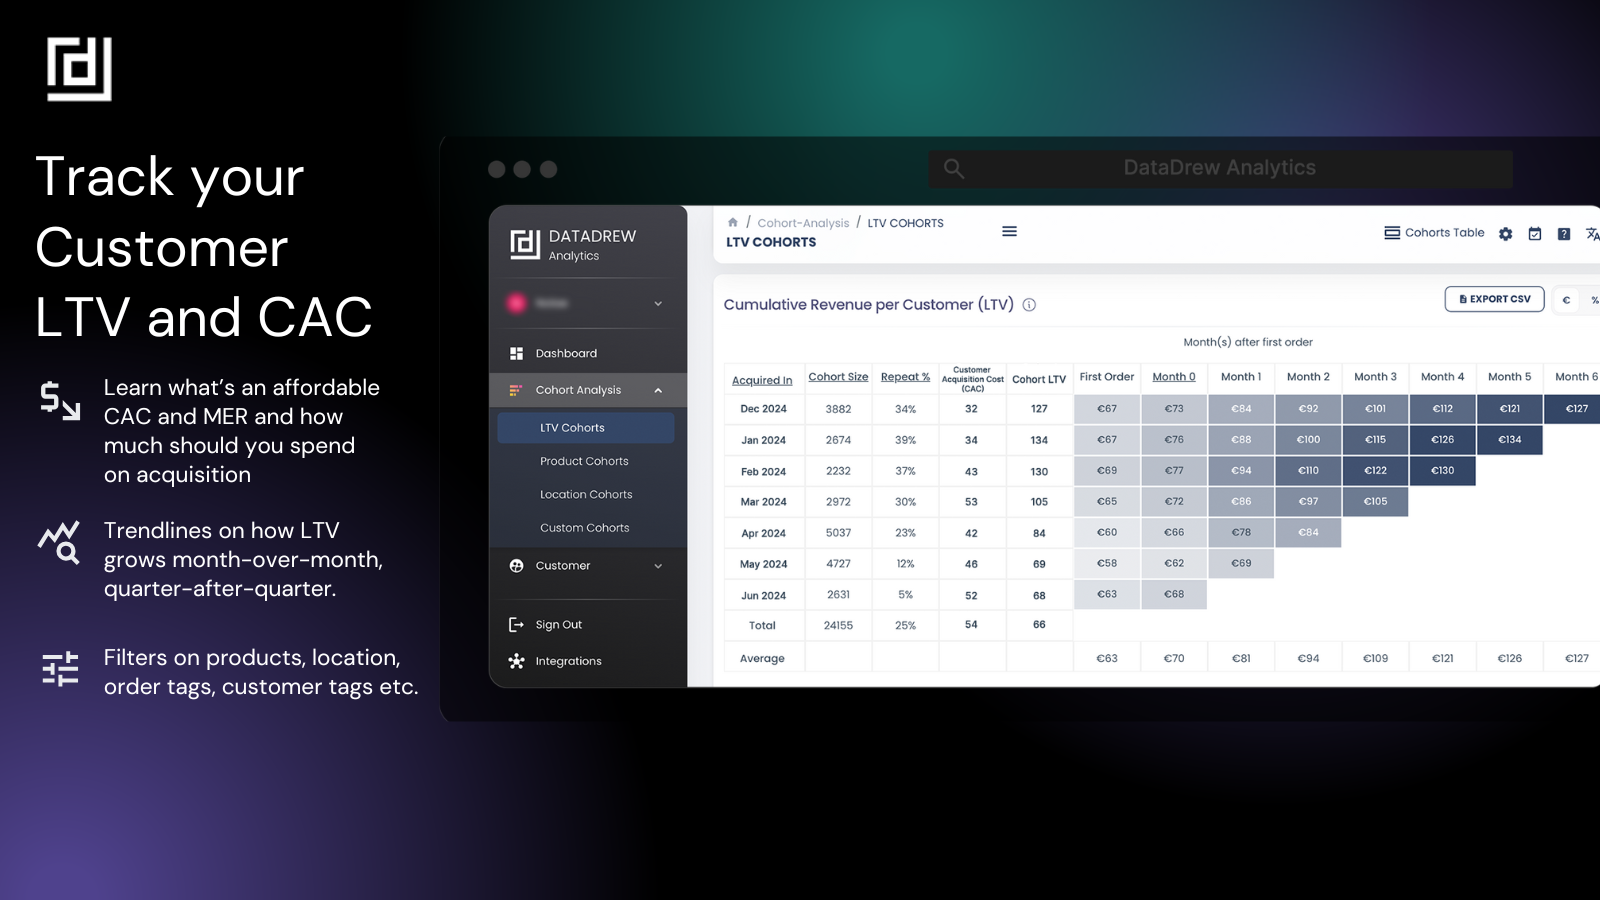
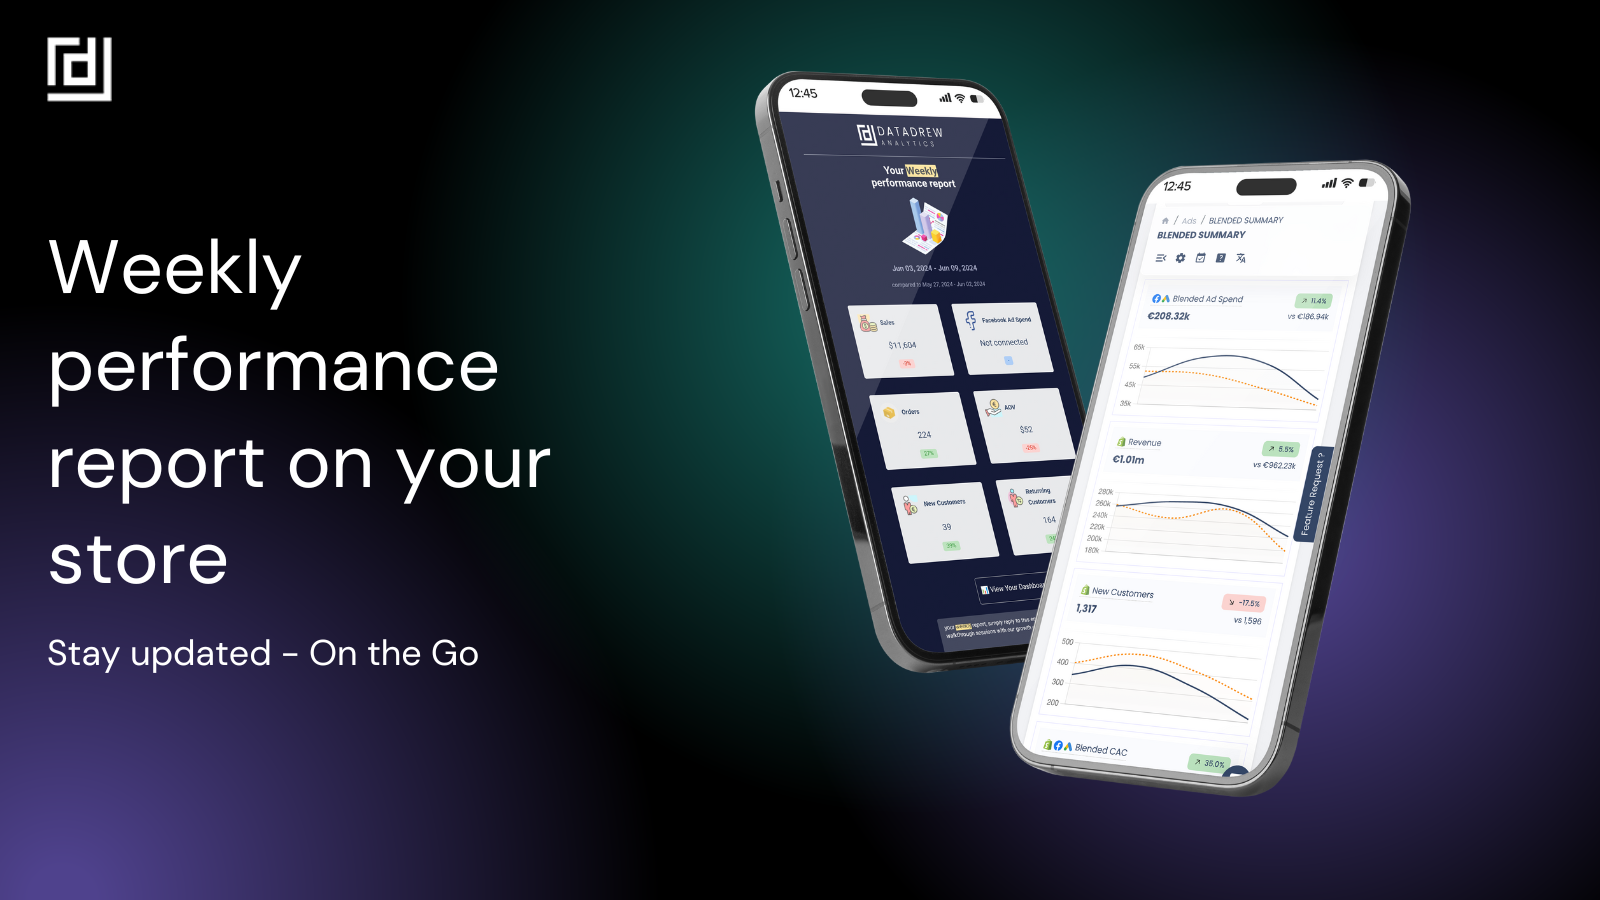
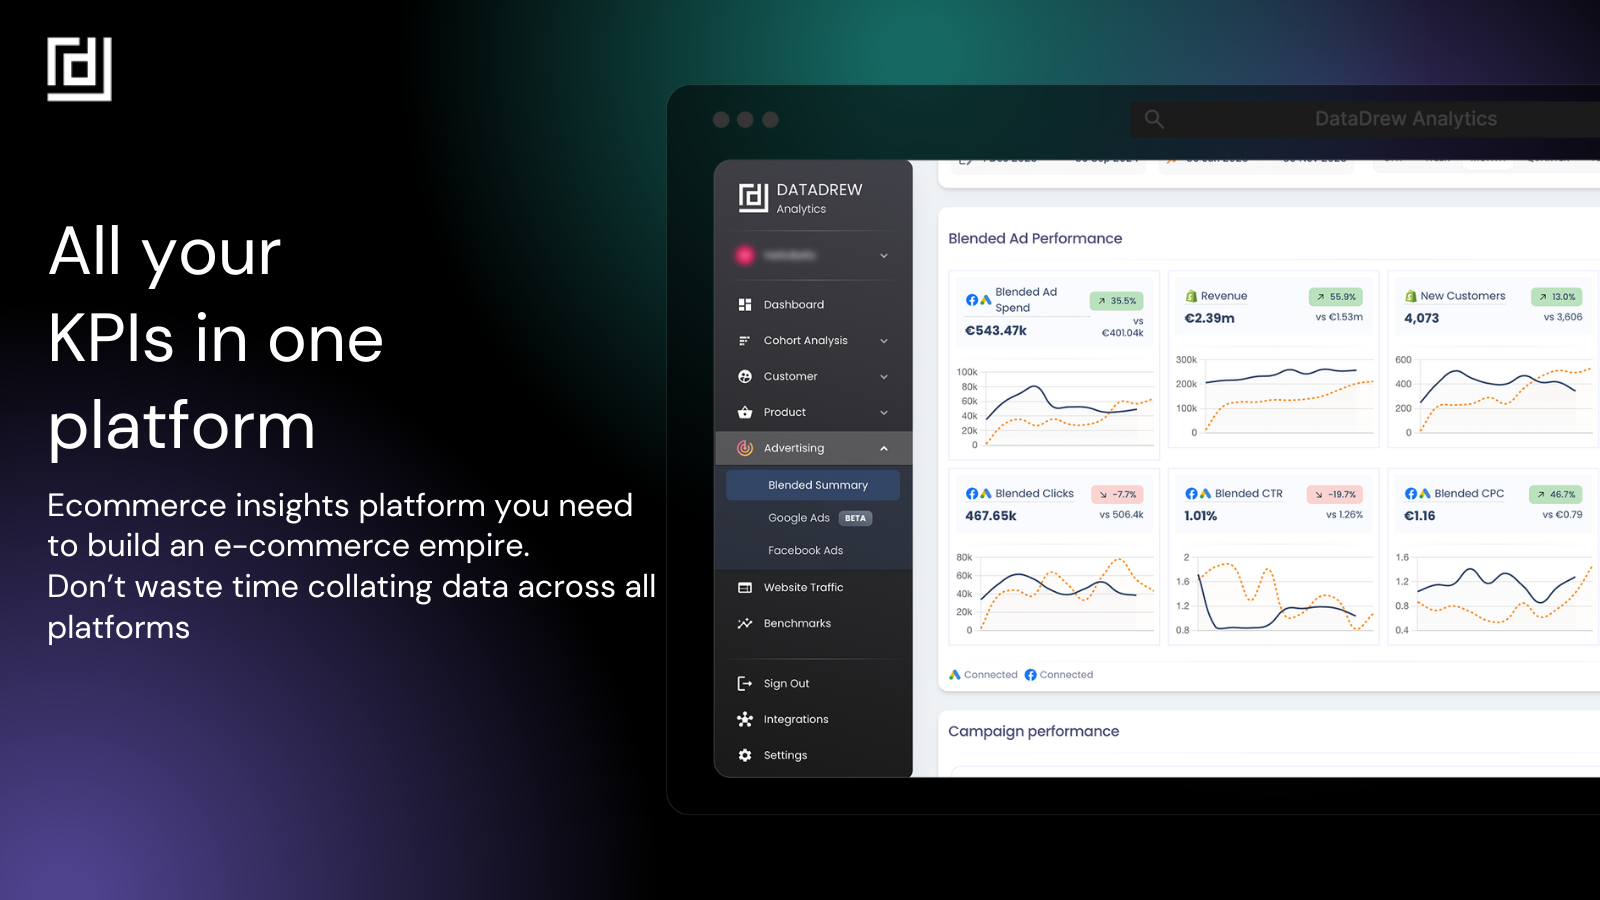
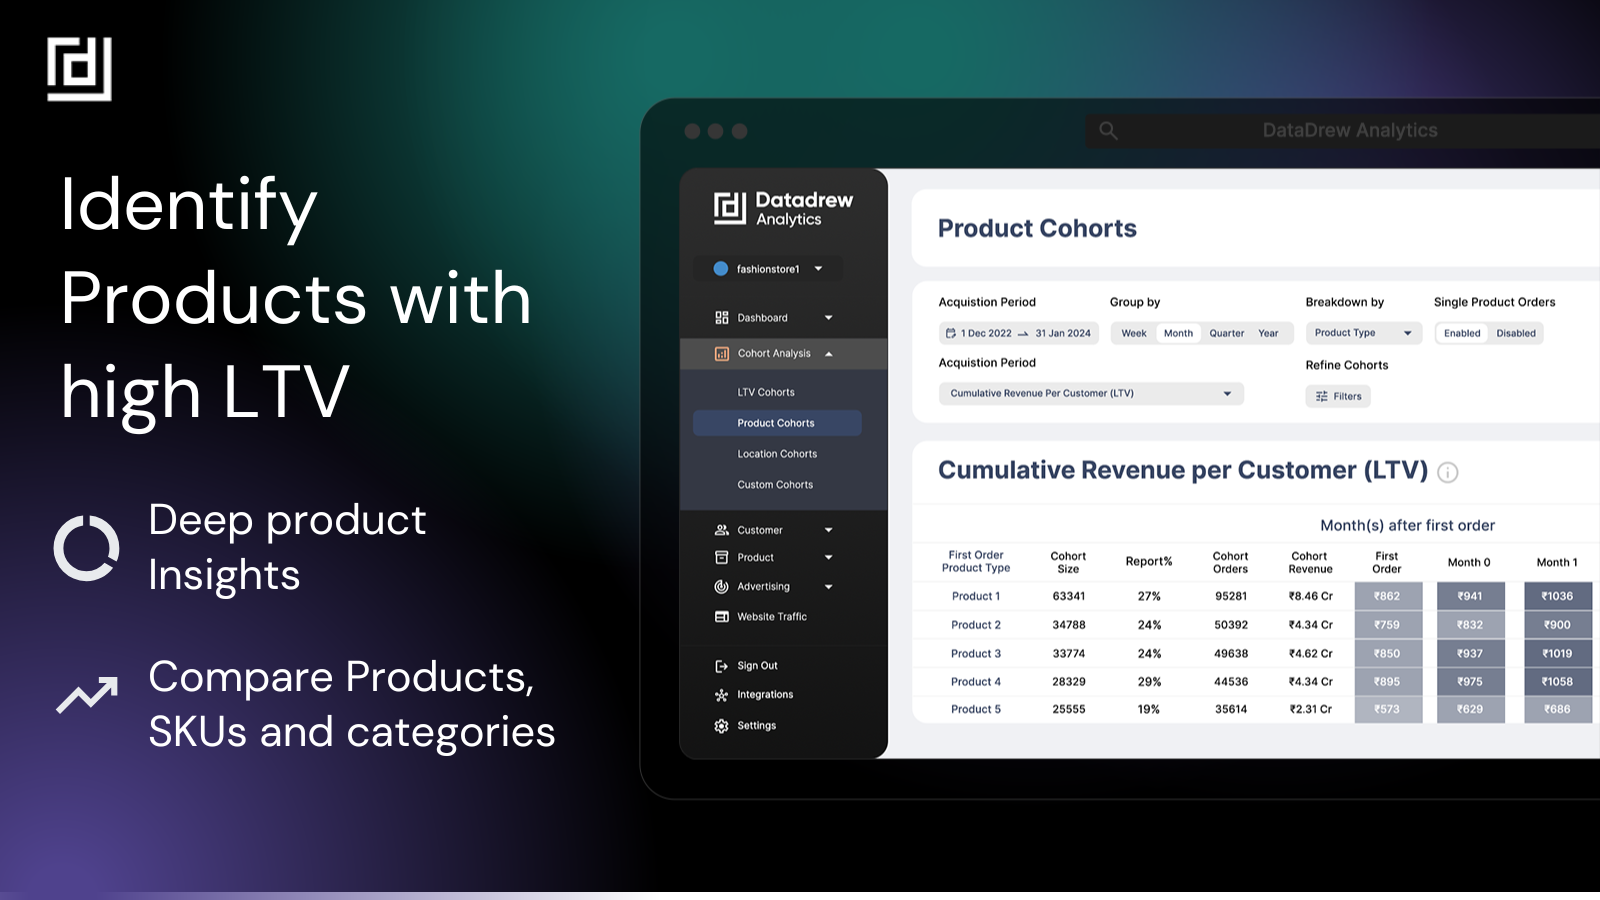
Turn your data into actionable insights: Lifetime Value LTV
Track & Improve CLTV, Cohort analysis, Benchmarks, Products
Turn your data into actionable insights: Lifetime Value LTV
Track & Improve CLTV, Cohort analysis, Benchmarks, Products
16460
Average Rating:2.4
Reviews:529,604
1
Average Rating:5
Reviews:28