Where Knowledge Meets Innovation
Visualize peak shopping times using detailed heatmap charts and export data.

151 O’Connor St, Ottawa, ON, ON, CA
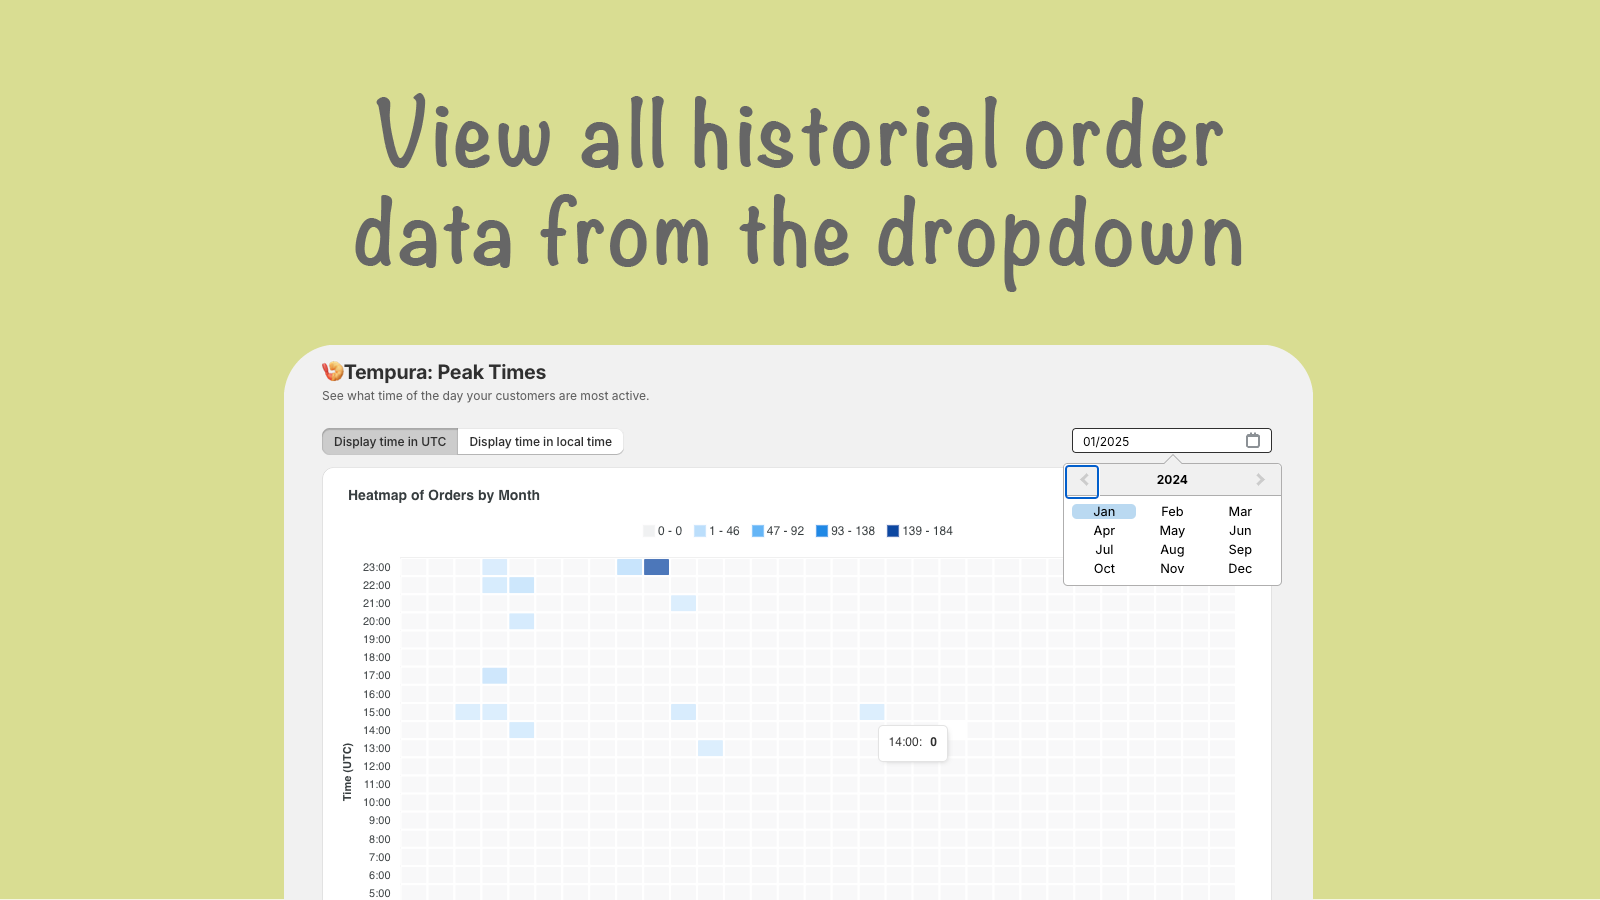
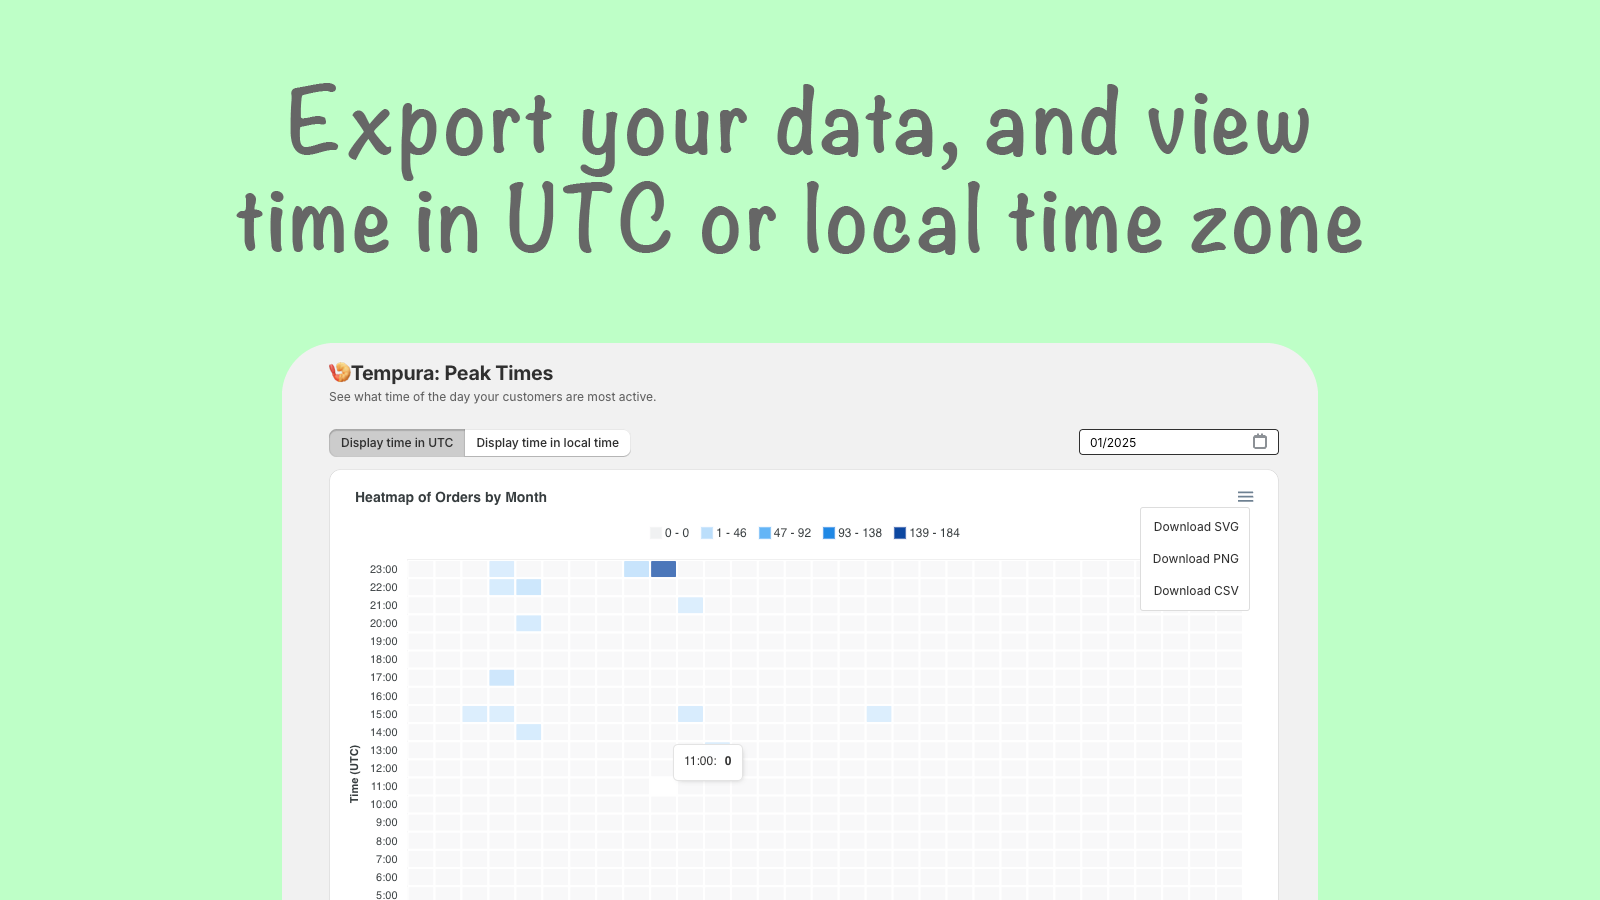
Website Support Portal Privacy policy Tutorial FAQ DocumentUse heatmap charts to understand patterns of shopping times, select the month you're interested in with the option to see all past months, and export the data in a file to use with external tooling for further analysis.
"Monitor, fix storefront errors with real-time AI alerts...
Automated Shopify profit dashboard with comprehensive cost...
Trackmint: Optimize Shopify marketing and operations with...
"Optimize profits: Track real-time margins, inventory, and...