Taranker.Com Logo
eCommerce360 logo

eCommerce360

Develop by Shopify
Free plan available

Bridgeline's new e360 dashboard – keep your revenue climbing.

Actionable insights
Visualize website health
Custom performance reports
Track key metrics
Identify problem areas
Revenue strategy view

About eCommerce360

Launched Dec 21, 2022

Categories

Built by Shopify

Address

Cabin No. d08, Building No. 16/297 First Floor,, Dewsprout Building , Sulthan Bathery, Wayanad, KL, 673592, IN

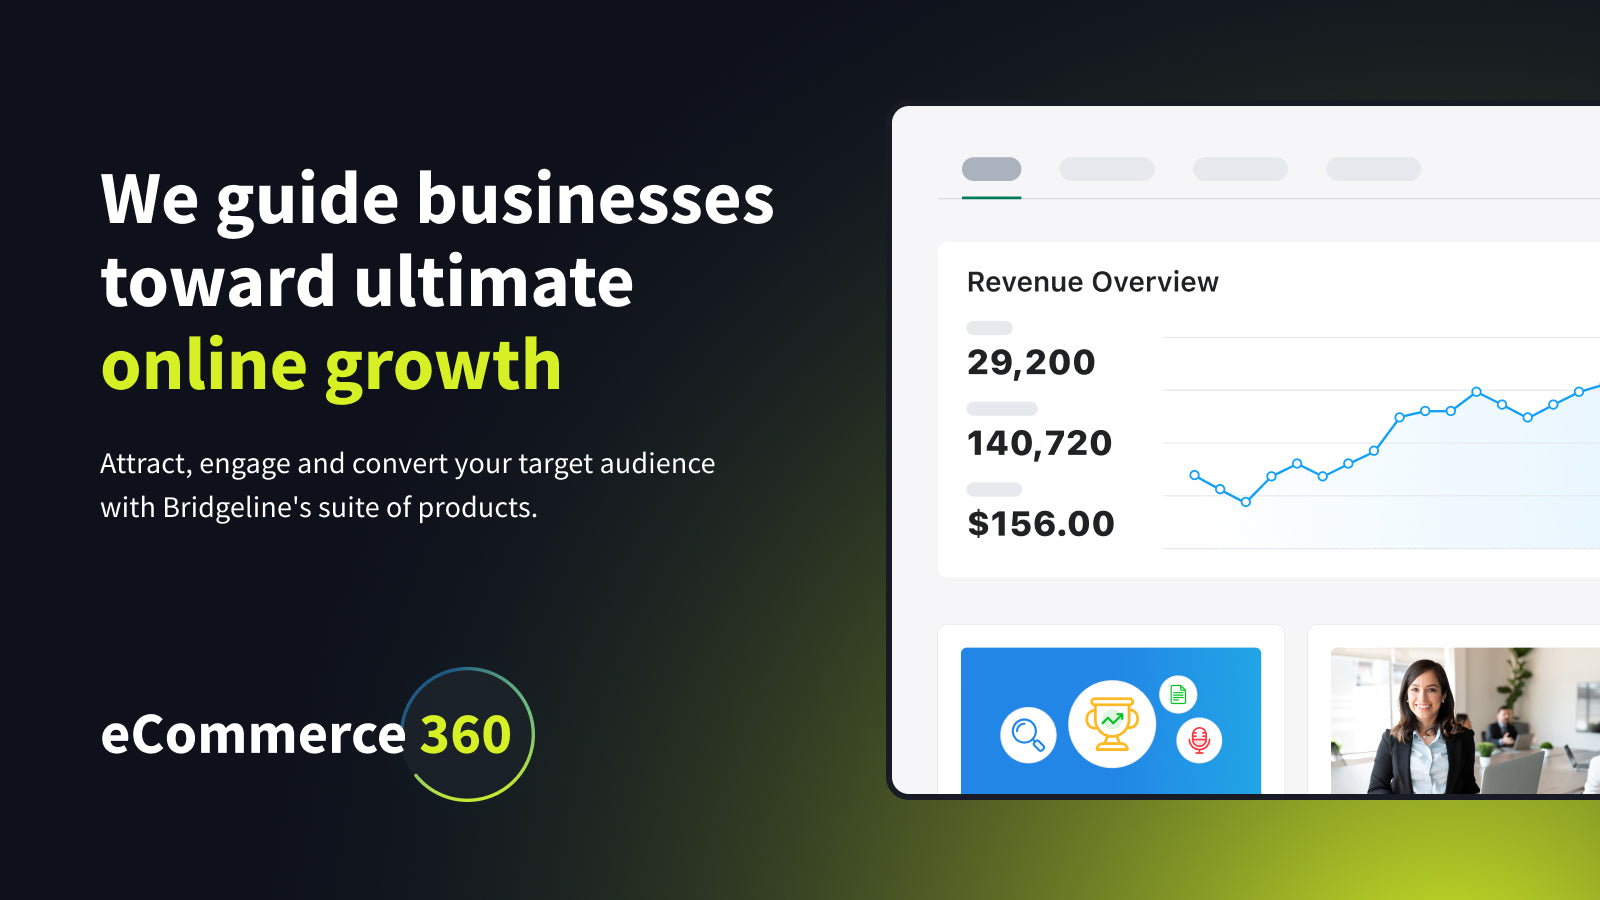
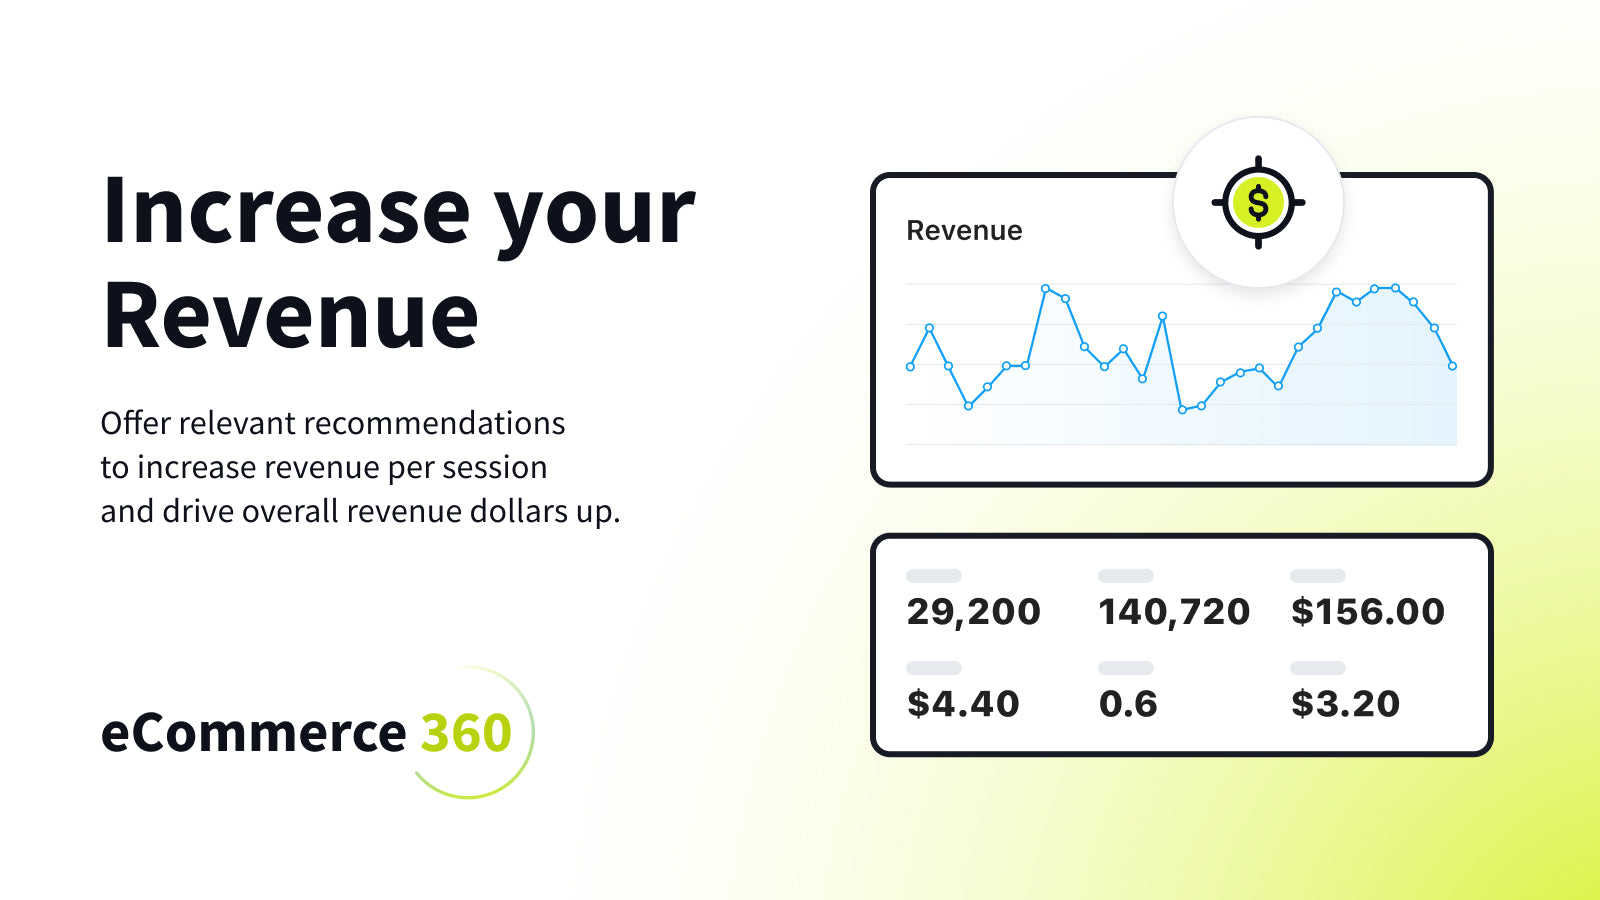
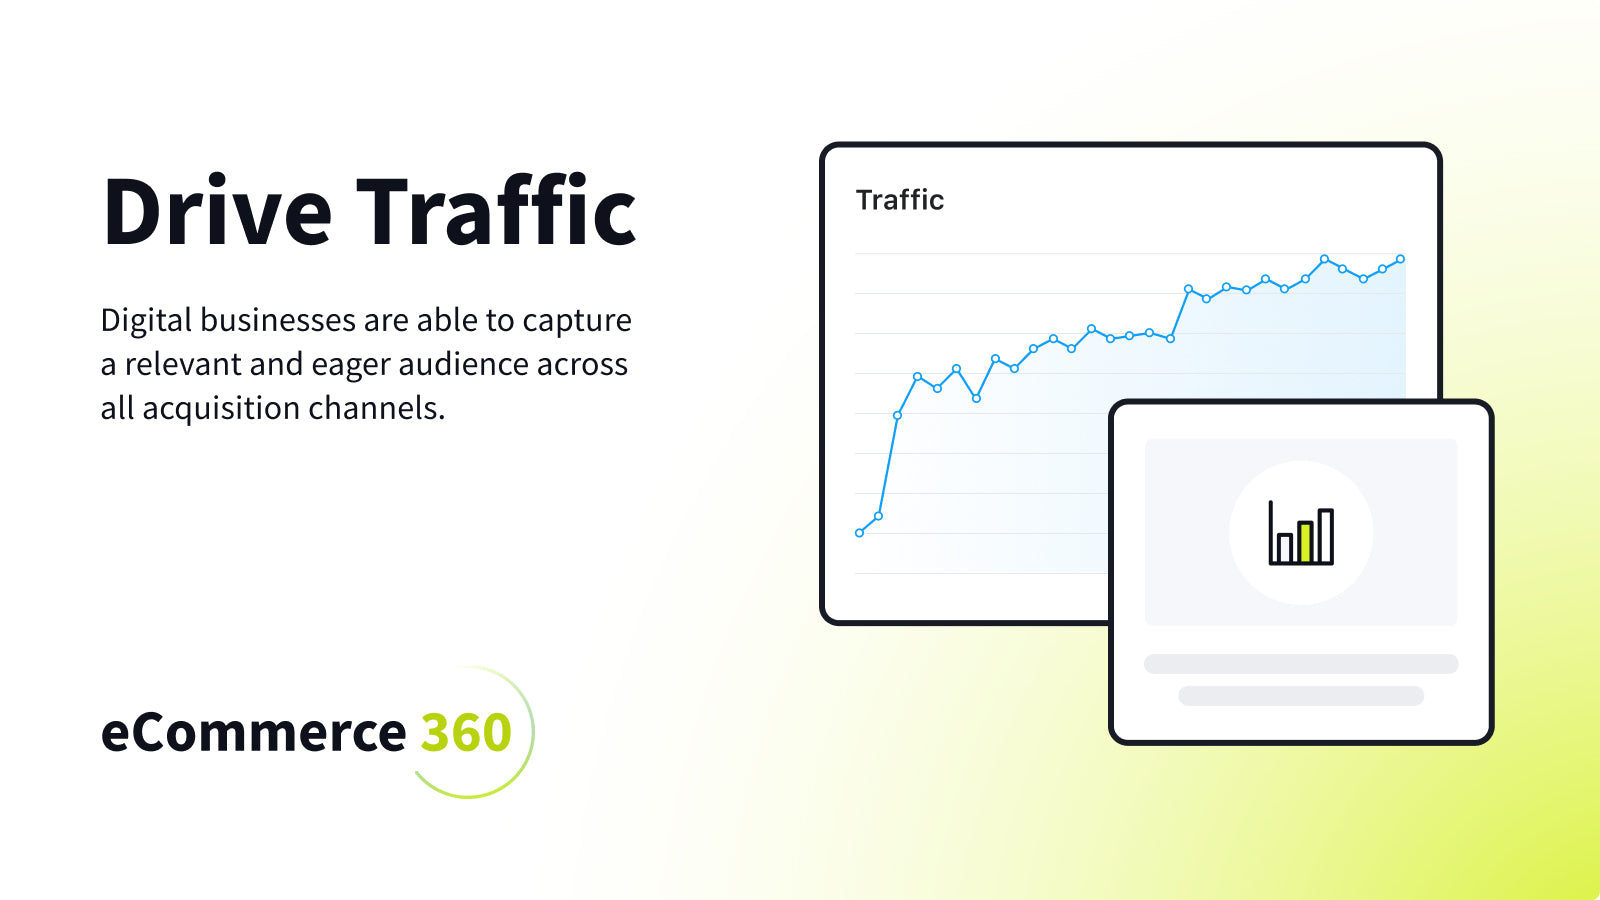
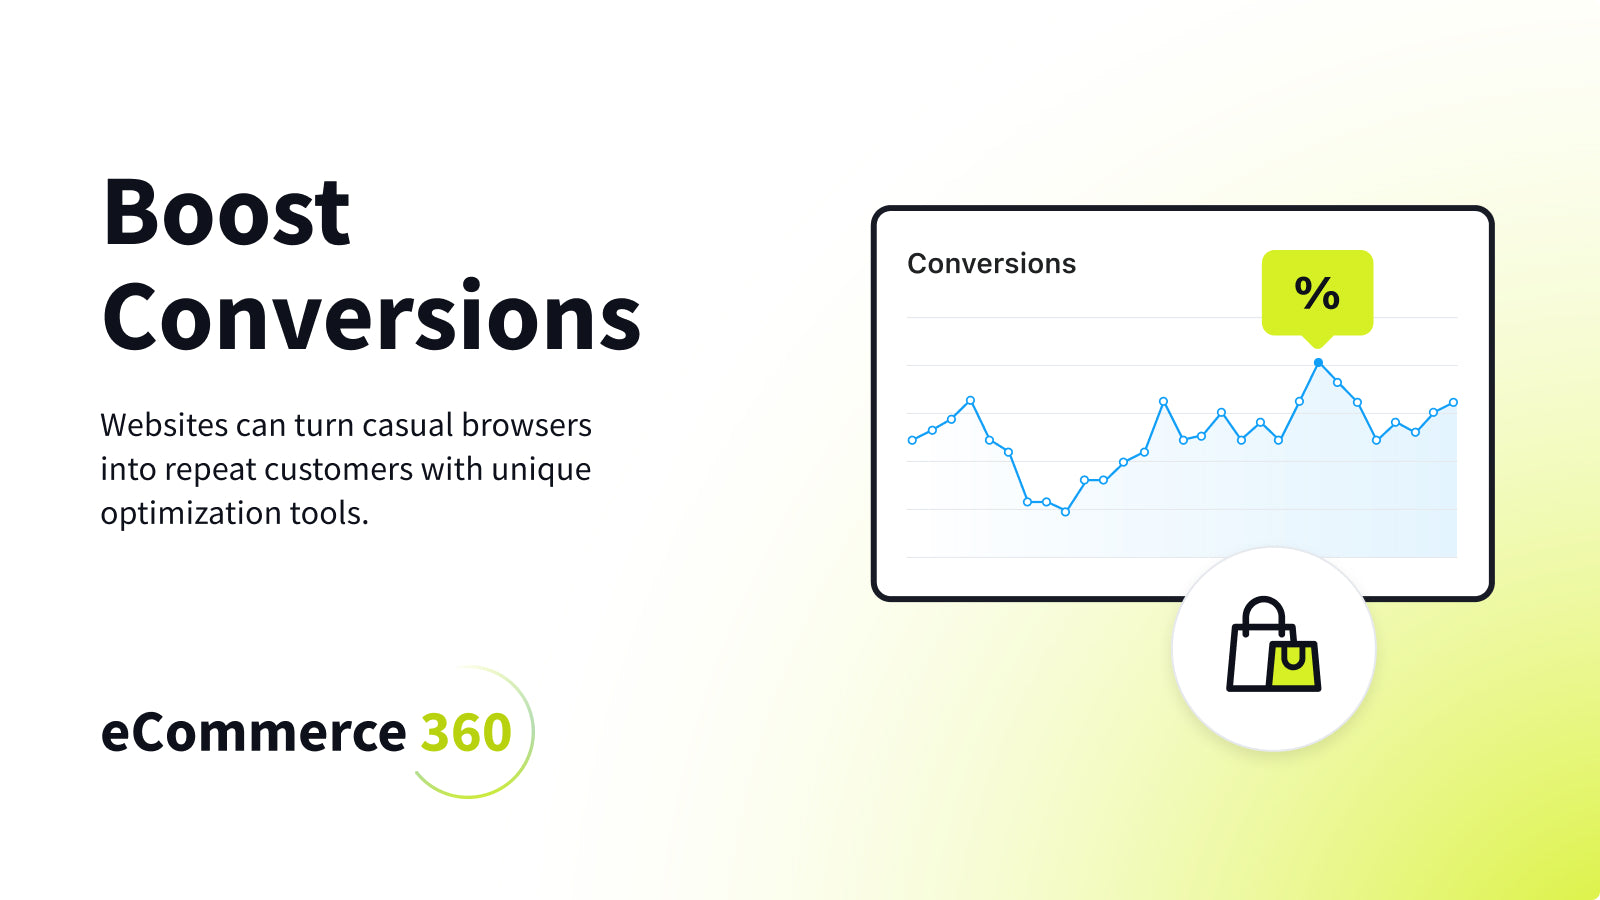
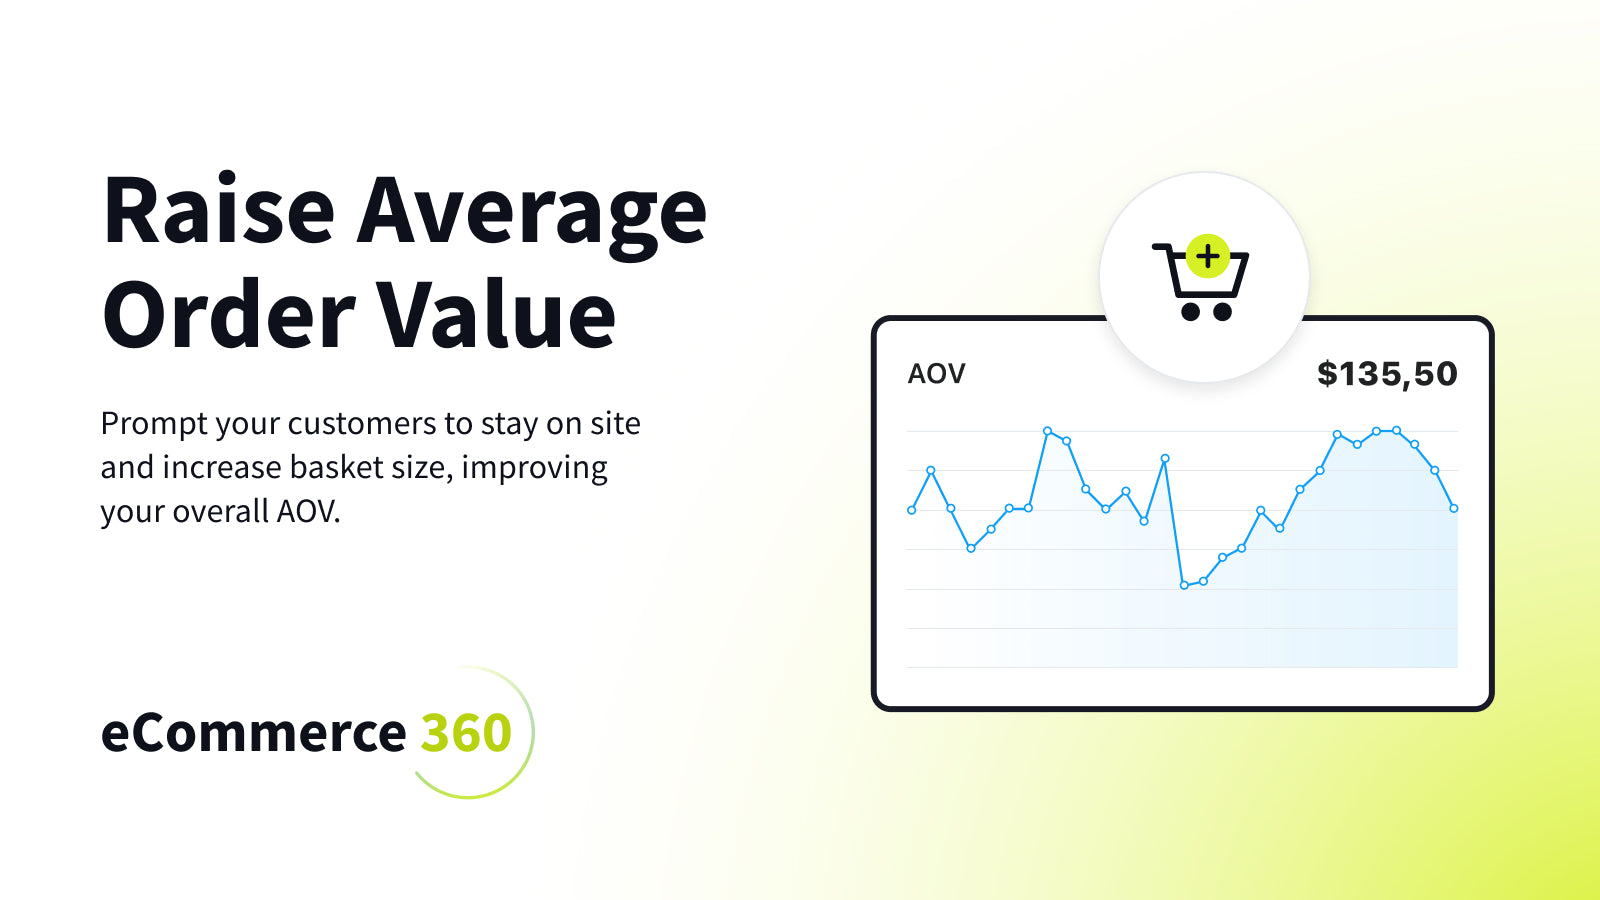
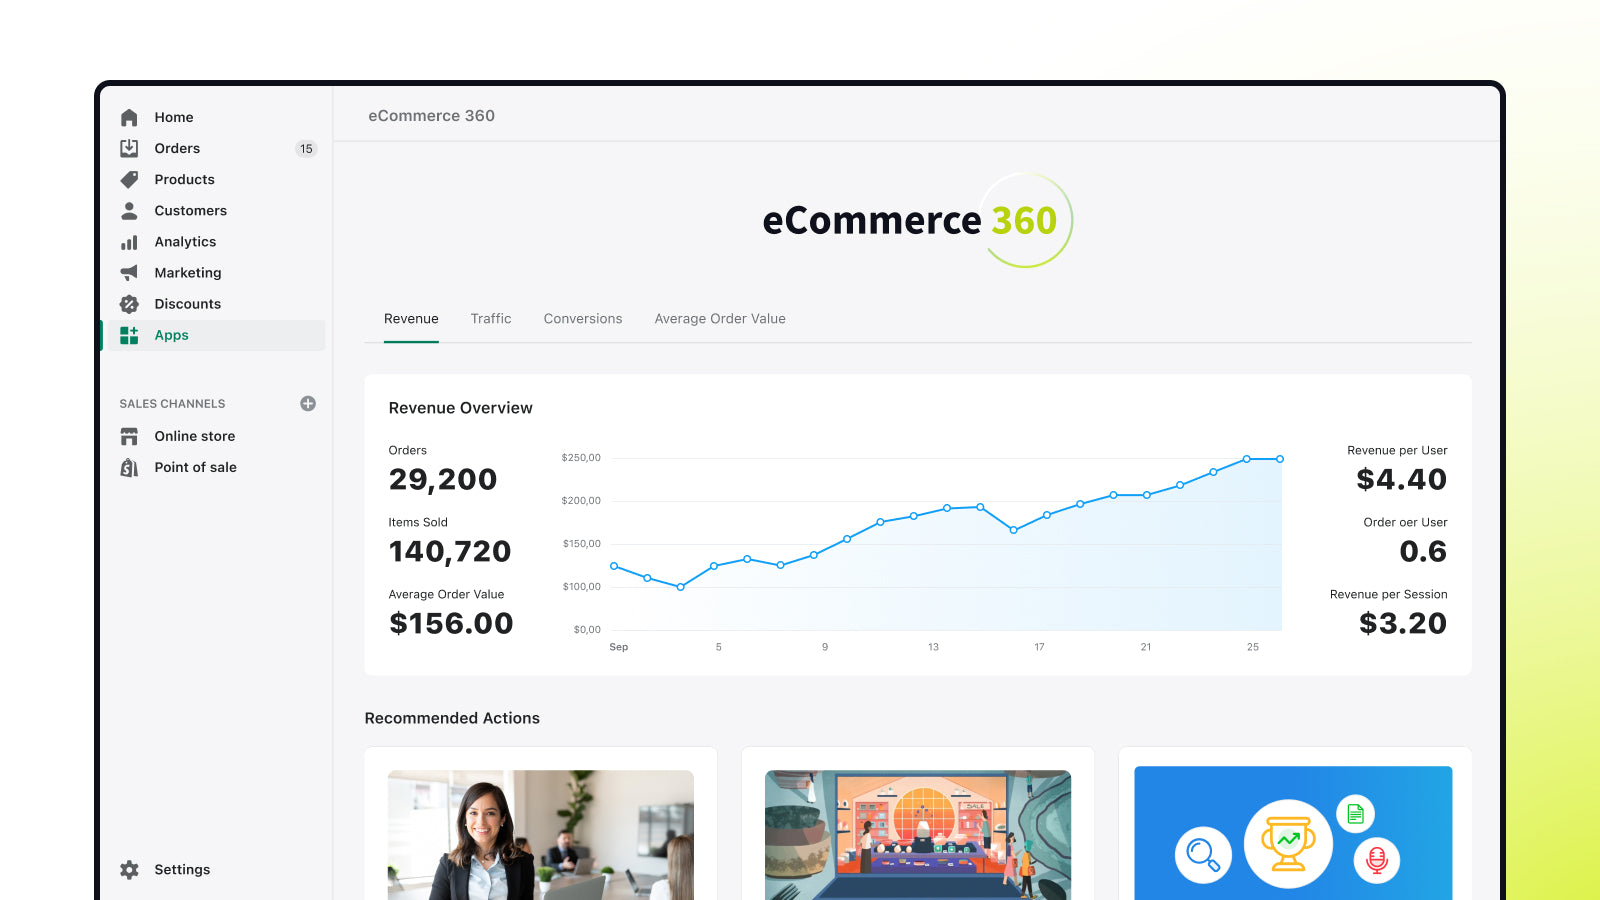
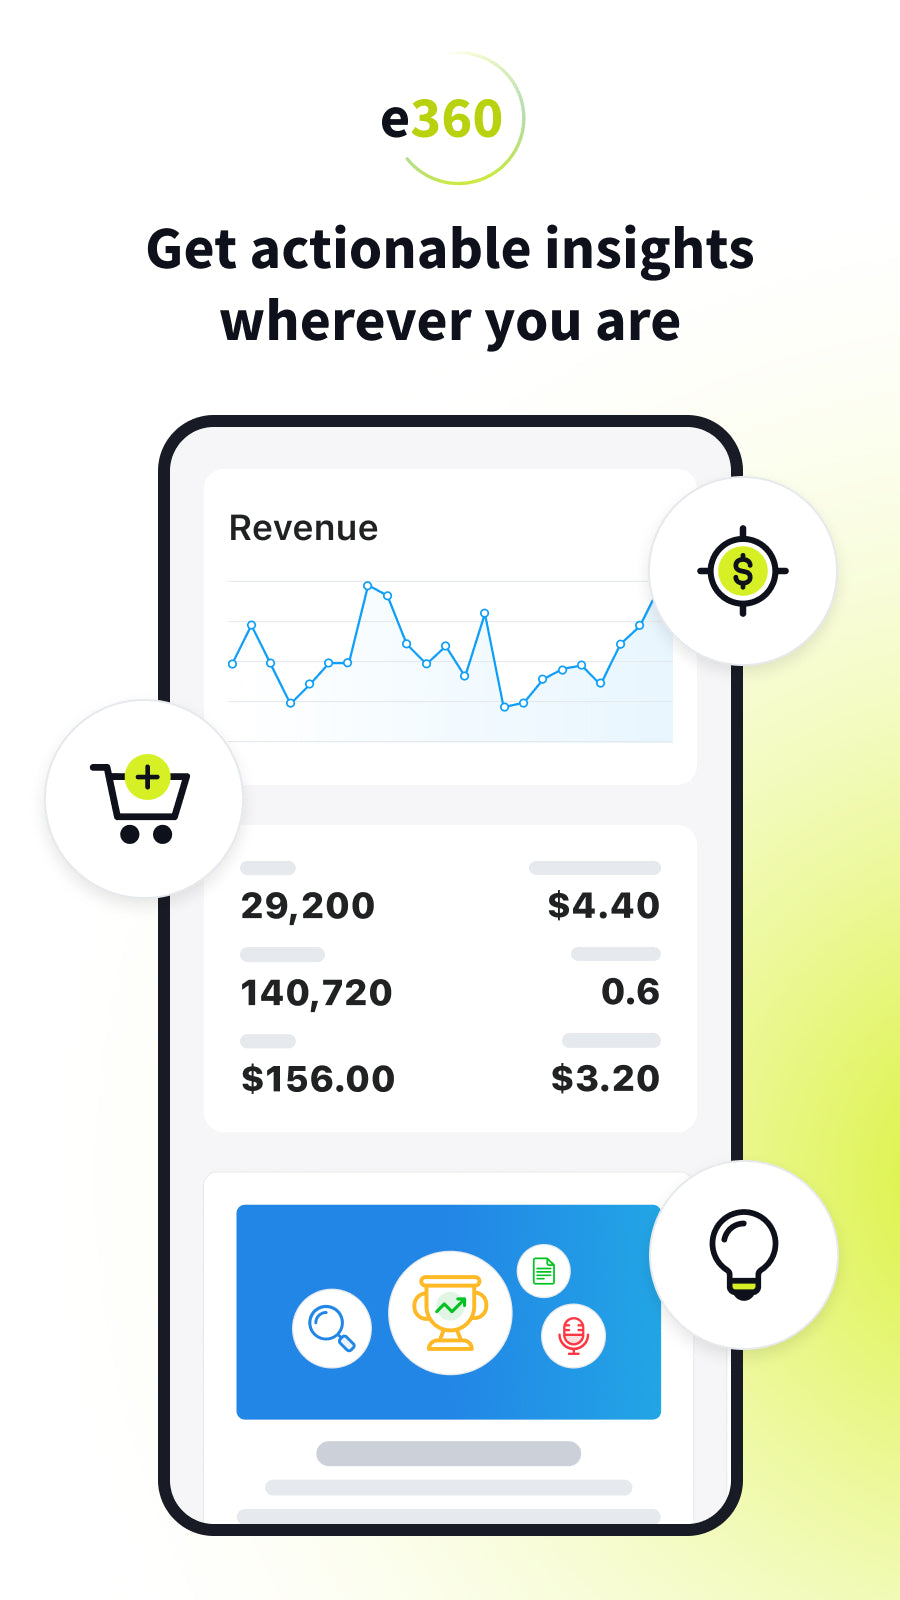
Website Support Portal Privacy policy Tutorial FAQ Document
Synctrack Order Tracking Page logo
(59 Reviews)
  • Sponsored

All-in-1 Order Tracker with a Branded Order Tracking Page

Description

The e360 dashboard is a tool specifically designed to empower your eCommerce business.

Visualize your website’s health in milliseconds. Stay up-to-date and keep tabs on performance – whether it be traffic, conversions, or average order value. The e360 dashboard consolidates your performance data into one place with custom reporting using your business’s insights. Track everything from traffic, conversion, and average order value and get actionable insights to maximize revenue. Dive into problem areas to identify, improve, and grow.

Visualize your website’s health in milliseconds. Stay up-to-date and keep tabs on performance – whether it be traffic, conversions, or average order value. The e360 dashboard consolidates your performance data into one place with custom reporting using your business’s insights. Track everything from traffic, conversion, and average order value and get actionable insights to maximize revenue. Dive into problem areas to identify, improve, and grow. more
  • Get an at-a-glance view of your website’s health and revenue strategy.
  • A prescriptive dashboard creates custom reports using our extensive data set.
  • Track key metrics like traffic and conversion rates to get actionable insights.

Pros

  • Provides a comprehensive view of website health and performance metrics
  • Enables quick visualization of traffic, conversions, and average order value
  • Consolidates performance data into a single dashboard, enhancing ease of use
  • Offers custom reporting tailored to business insights, allowing for personalized analysis
  • Facilitates identification of problem areas for targeted improvements and growth
  • Delivers actionable insights to aid in maximizing revenue

Cons

  • May require a learning curve for users unfamiliar with data analytics tools
  • Limited information on integration capabilities with other systems
  • Potential for data overload if not filtered properly, which might overwhelm new users
  • Lacks detailed user feedback on specific features such as dashboard customization or layouts

More App like this

Convbox Analytics logo
(39 Reviews)
$299-$799 / Month
  • 15 Days Free Trial

Sync Multi Pixels for FB Conversion API & Google Ads...

TP: True Profit Analytics logo
(598 Reviews)
$35-$200 / Month
  • 14 Days Free Trial

Know your True Net Profit, Product & Marketing Analytics,...

Happy Birthday Emails by UW logo
(141 Reviews)
$10-$40 / Month
  • 28 Days Free Trial

Deepen customer loyalty by celebrating customer Birthdays

Data Export IO: Reports logo
(1,879 Reviews)
$7-$35 / Month
  • Free Plan Available
  • Verified

Easy premade and custom reports: filter, schedule, and more....

Scroll to Top