Where Knowledge Meets Innovation
Unlock insights and trends for smarter and clearer decisions
151 O’Connor St, Ottawa, ON, ON, CA
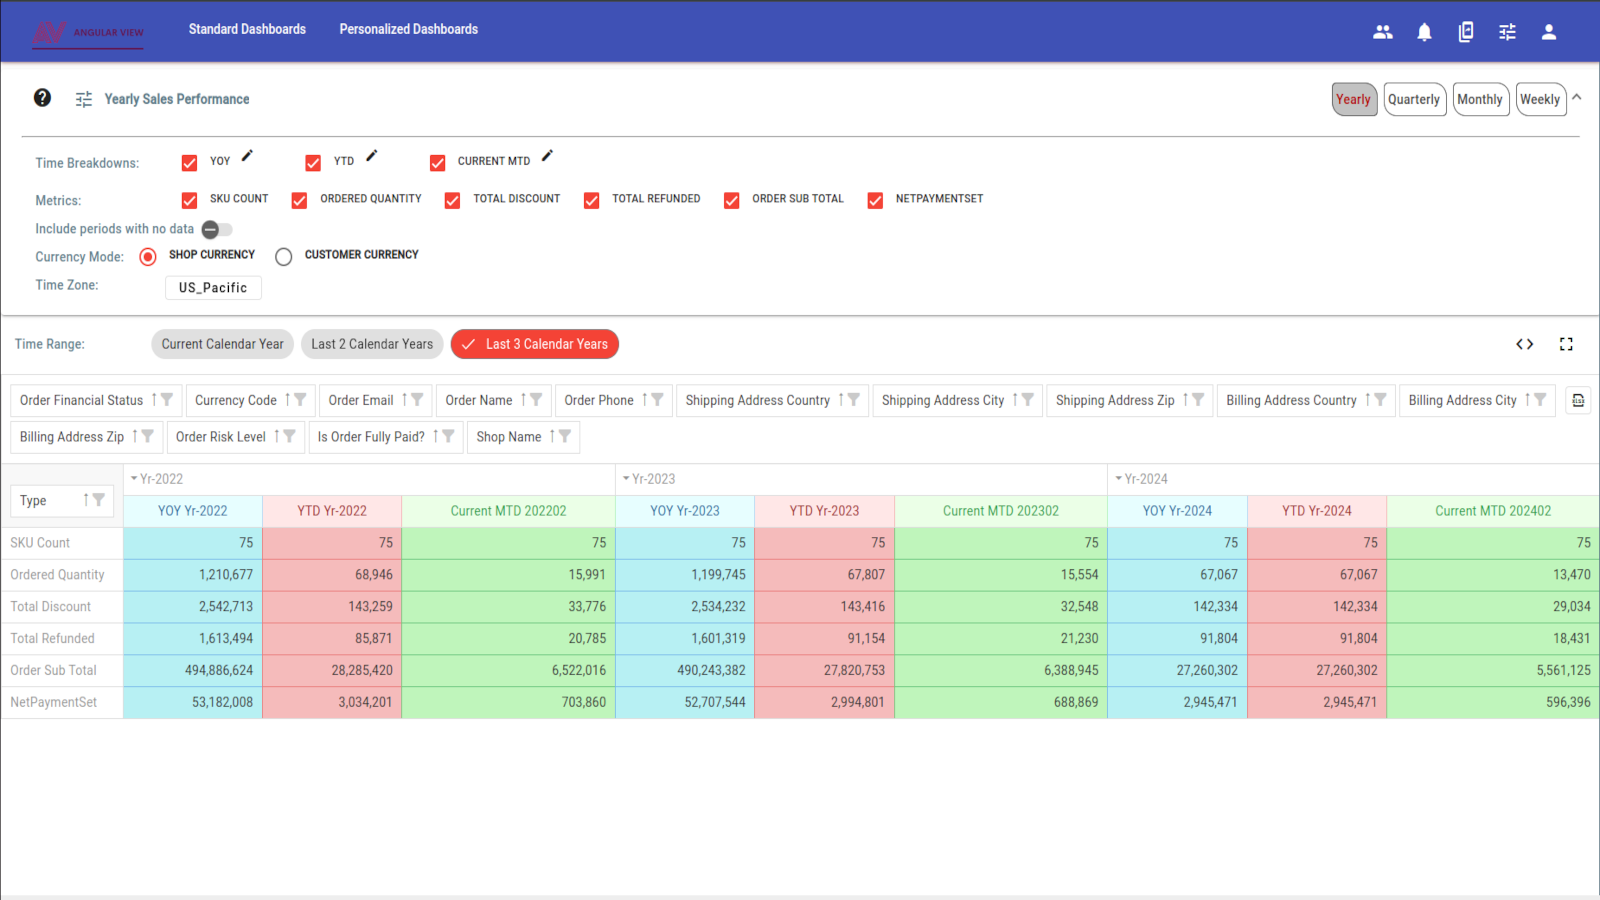
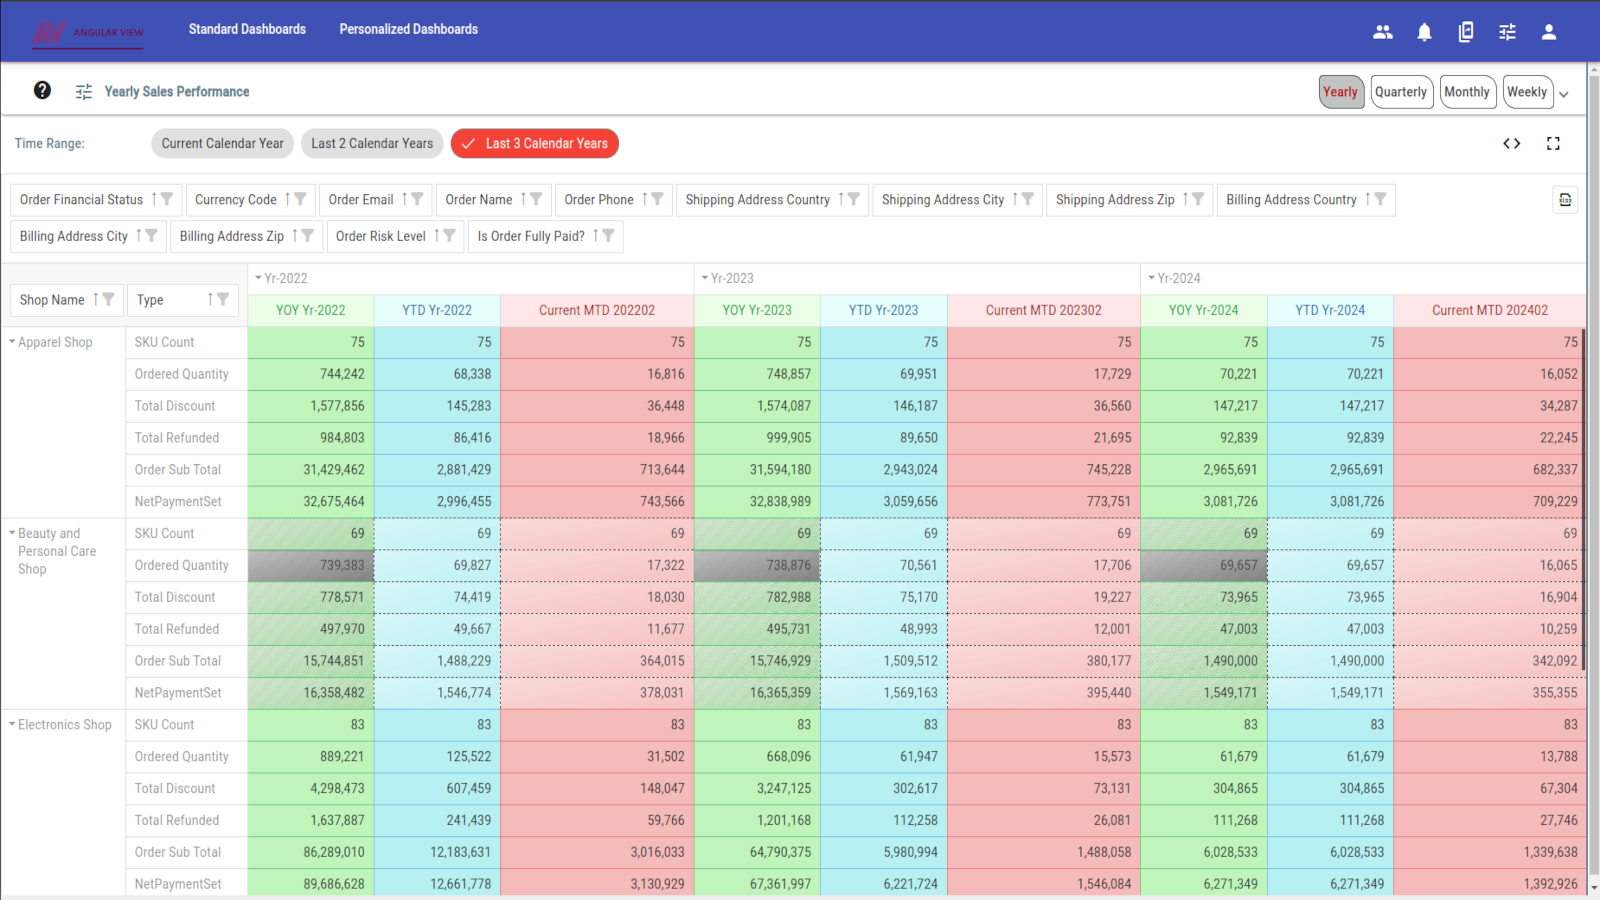
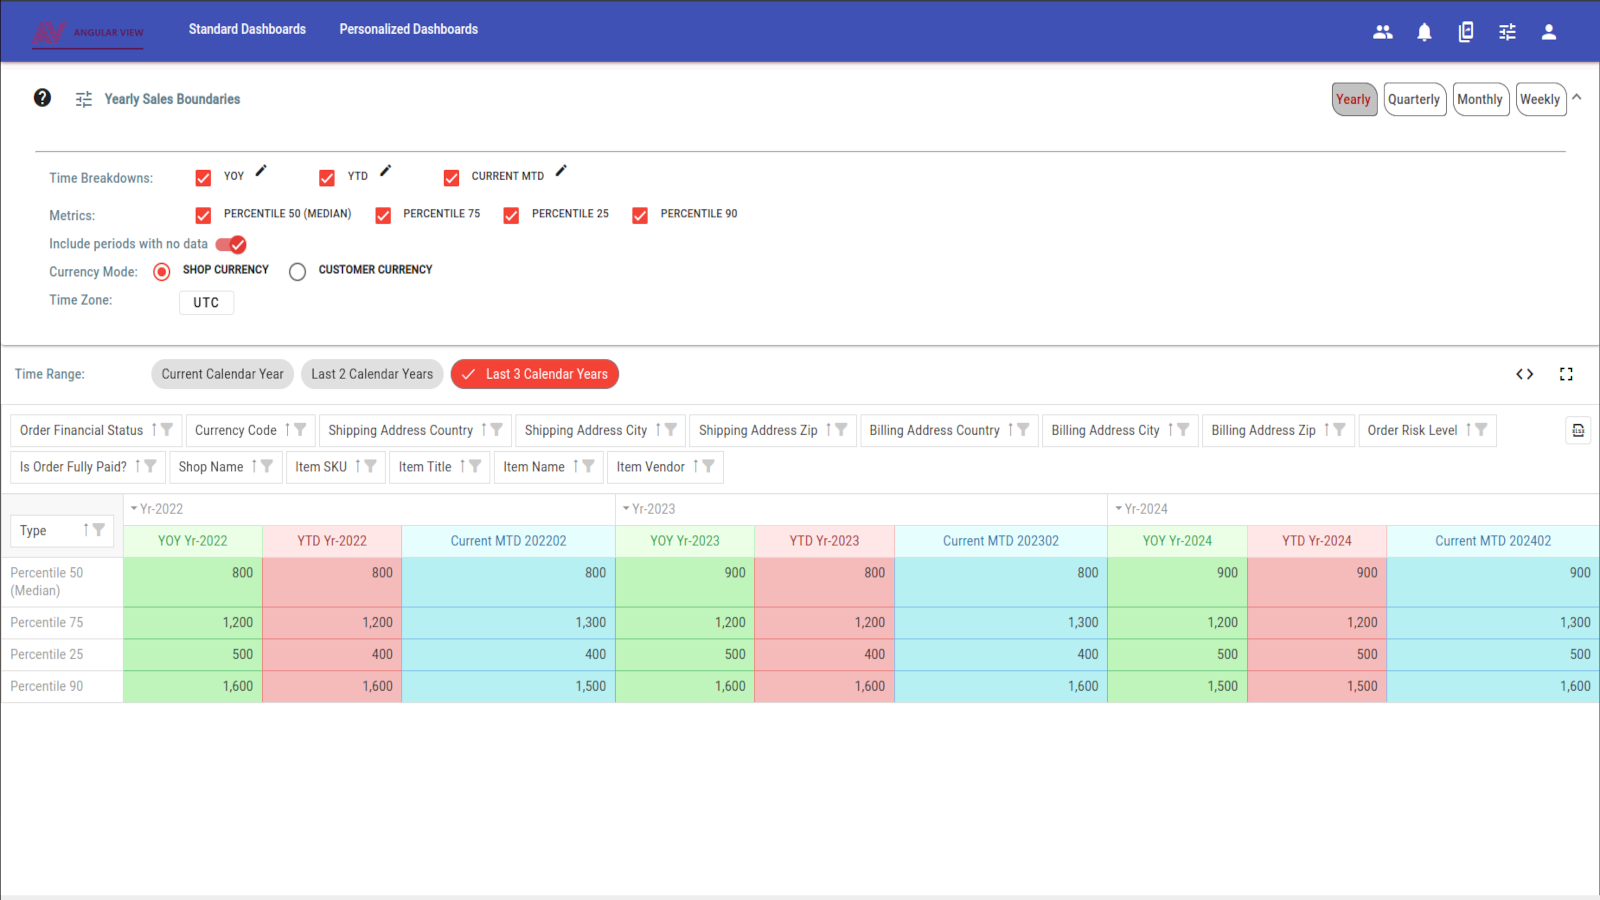
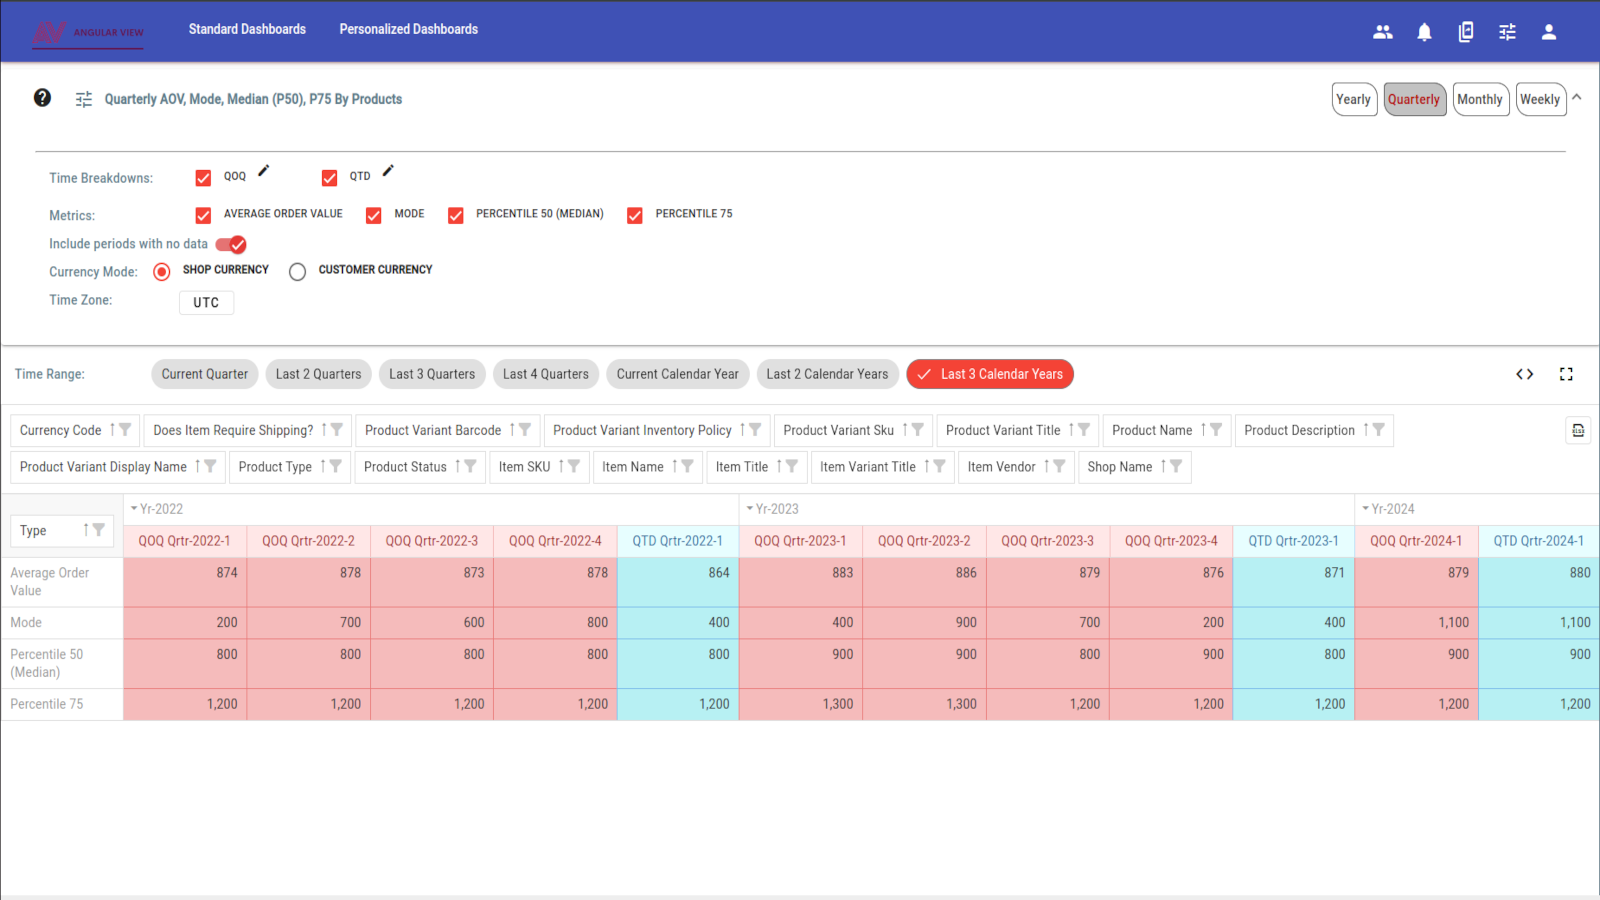
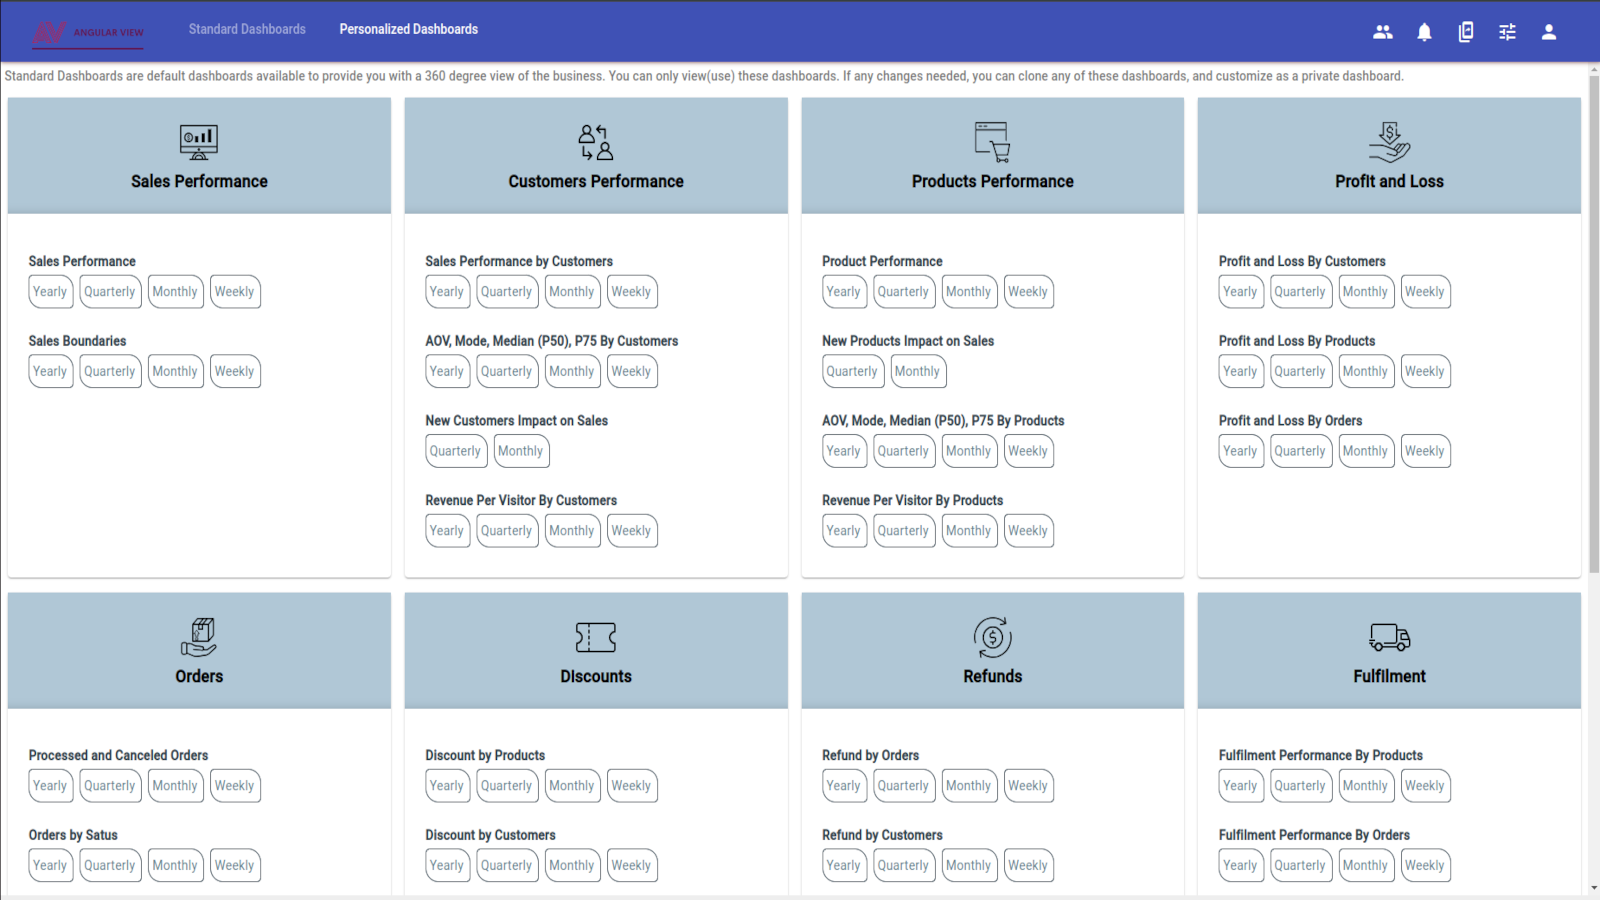
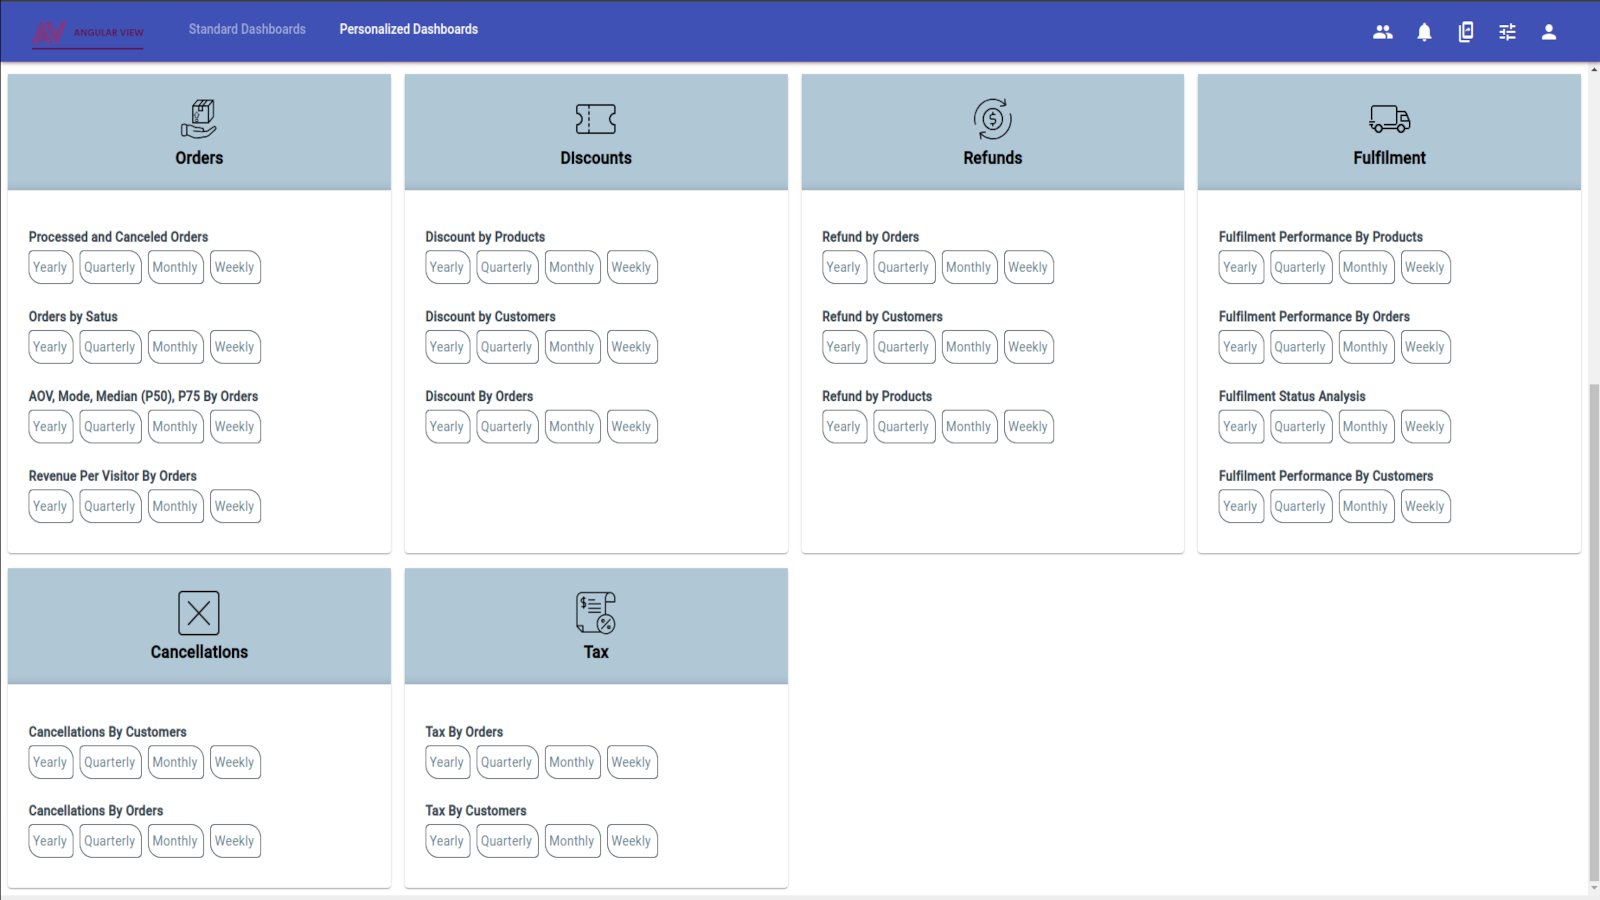
Website Support Portal Privacy policy Tutorial FAQ DocumentRunning multiple Shopify stores? Constantly switching dashboards and spreadsheets to make sense of the numbers? AngularView brings all your data into one place helping you track performance, compare stores, and uncover revenue opportunities in real time. ✅ Monitor key metrics like AOV, CLV, and refunds ✅ Track performance by currency, campaign, or channel ✅ Tailor dashboards for your team—from marketing to ops AngularView simplifies decision-making and turns complex data into business clarity.
Automate Shopify checks for SEO, product data, inventory,...
Enhance AI visibility, streamline strategies, and optimize...
Track product, order, and customer changes with historical...
"Monitor, fix storefront errors with real-time AI alerts...