Where Knowledge Meets Innovation
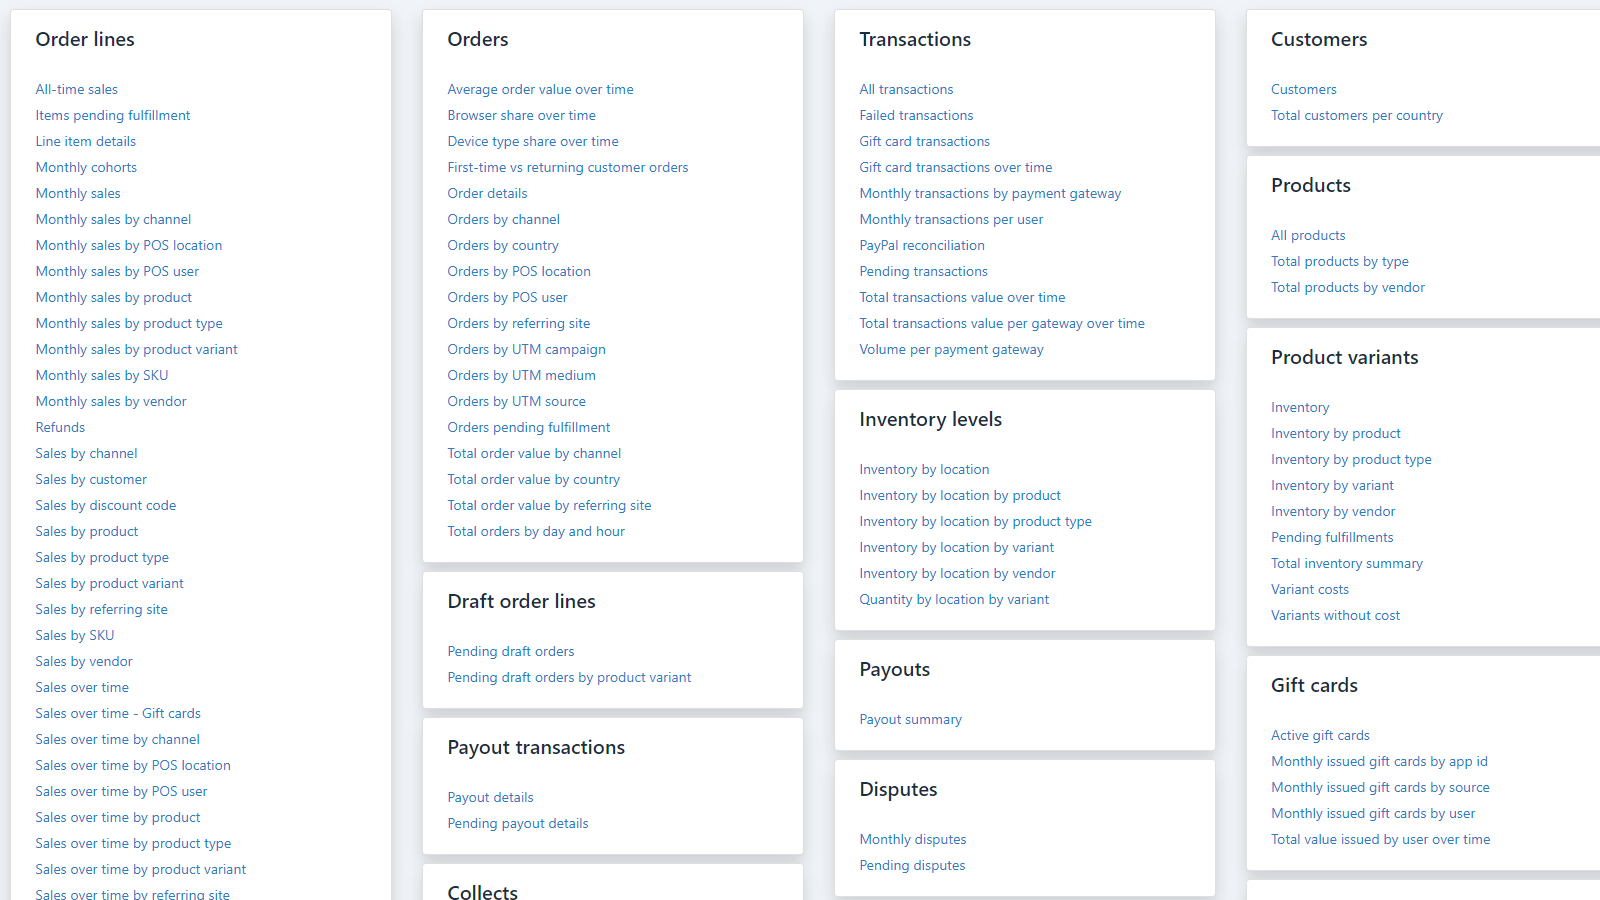
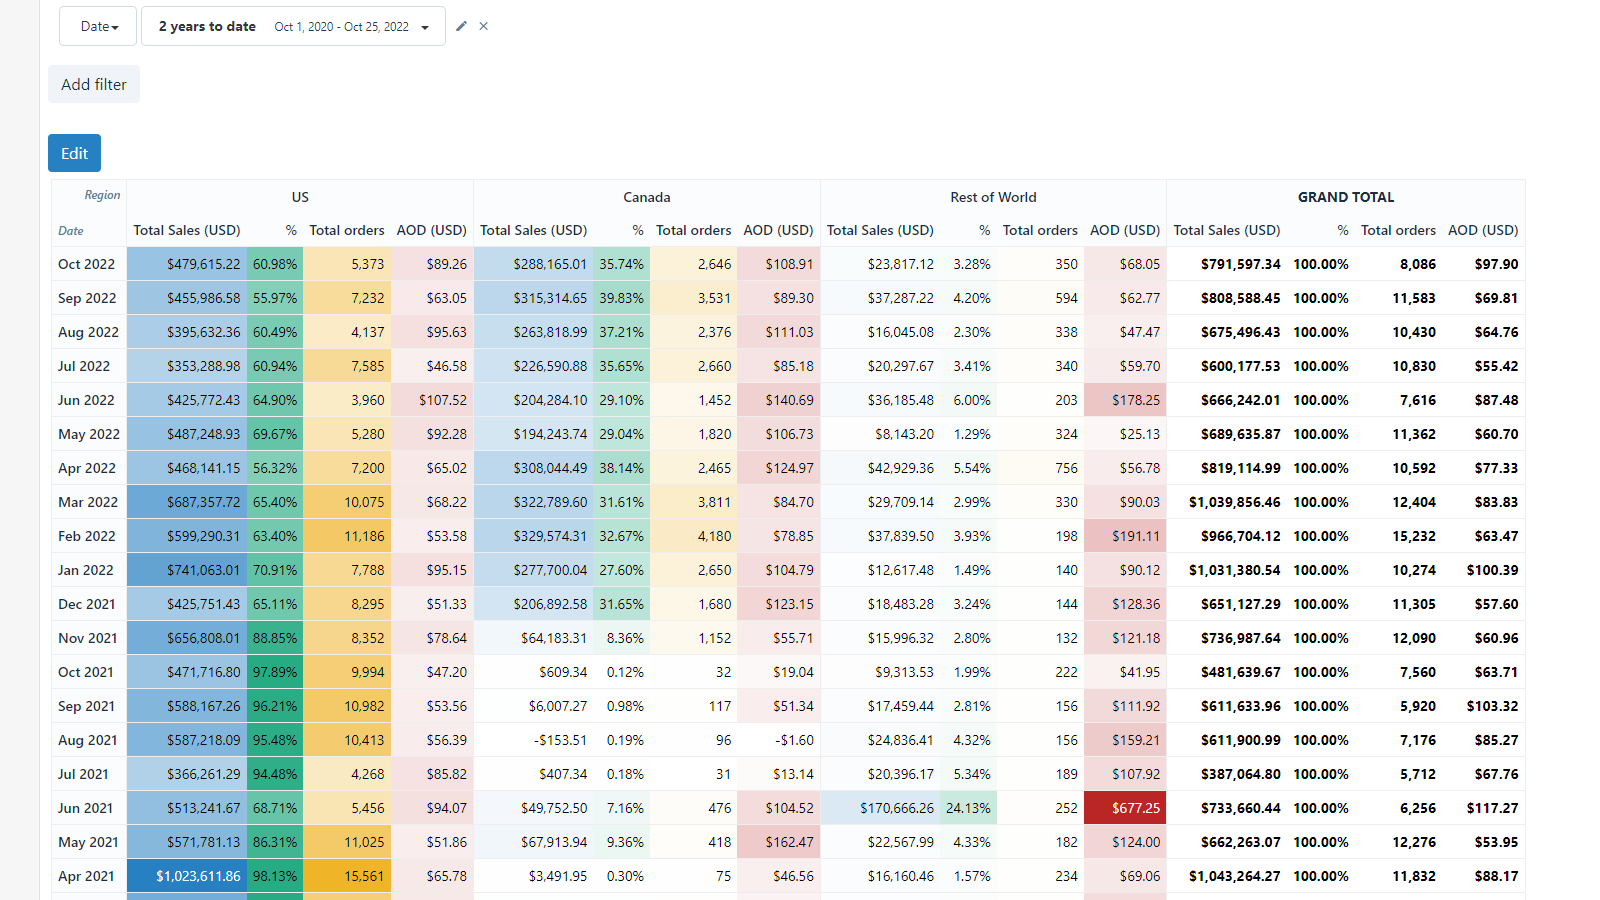
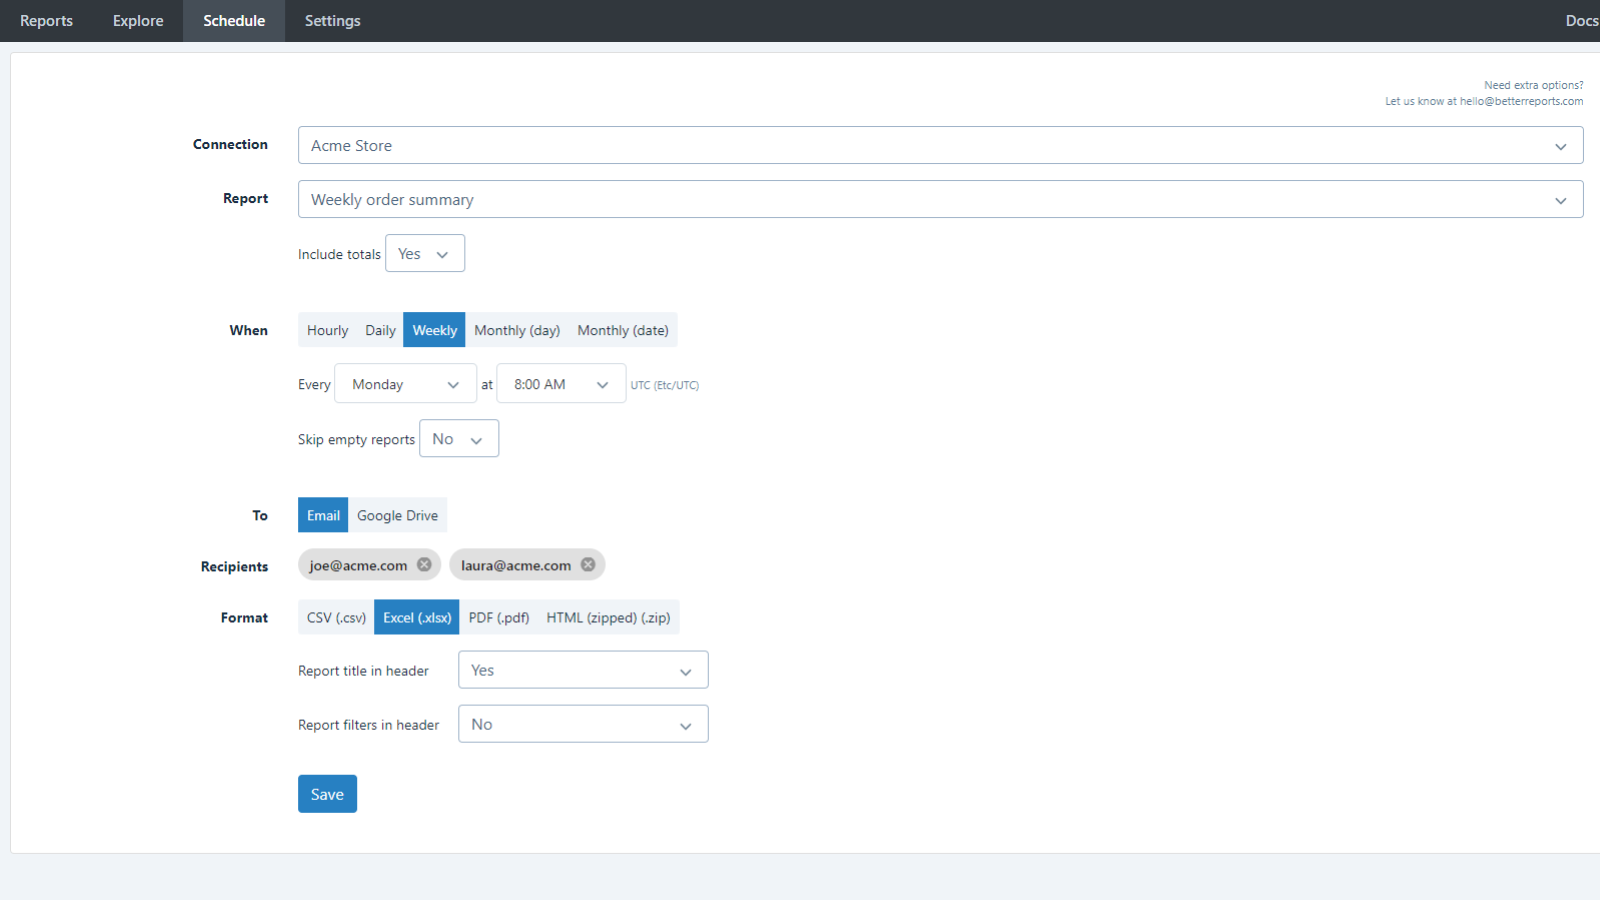
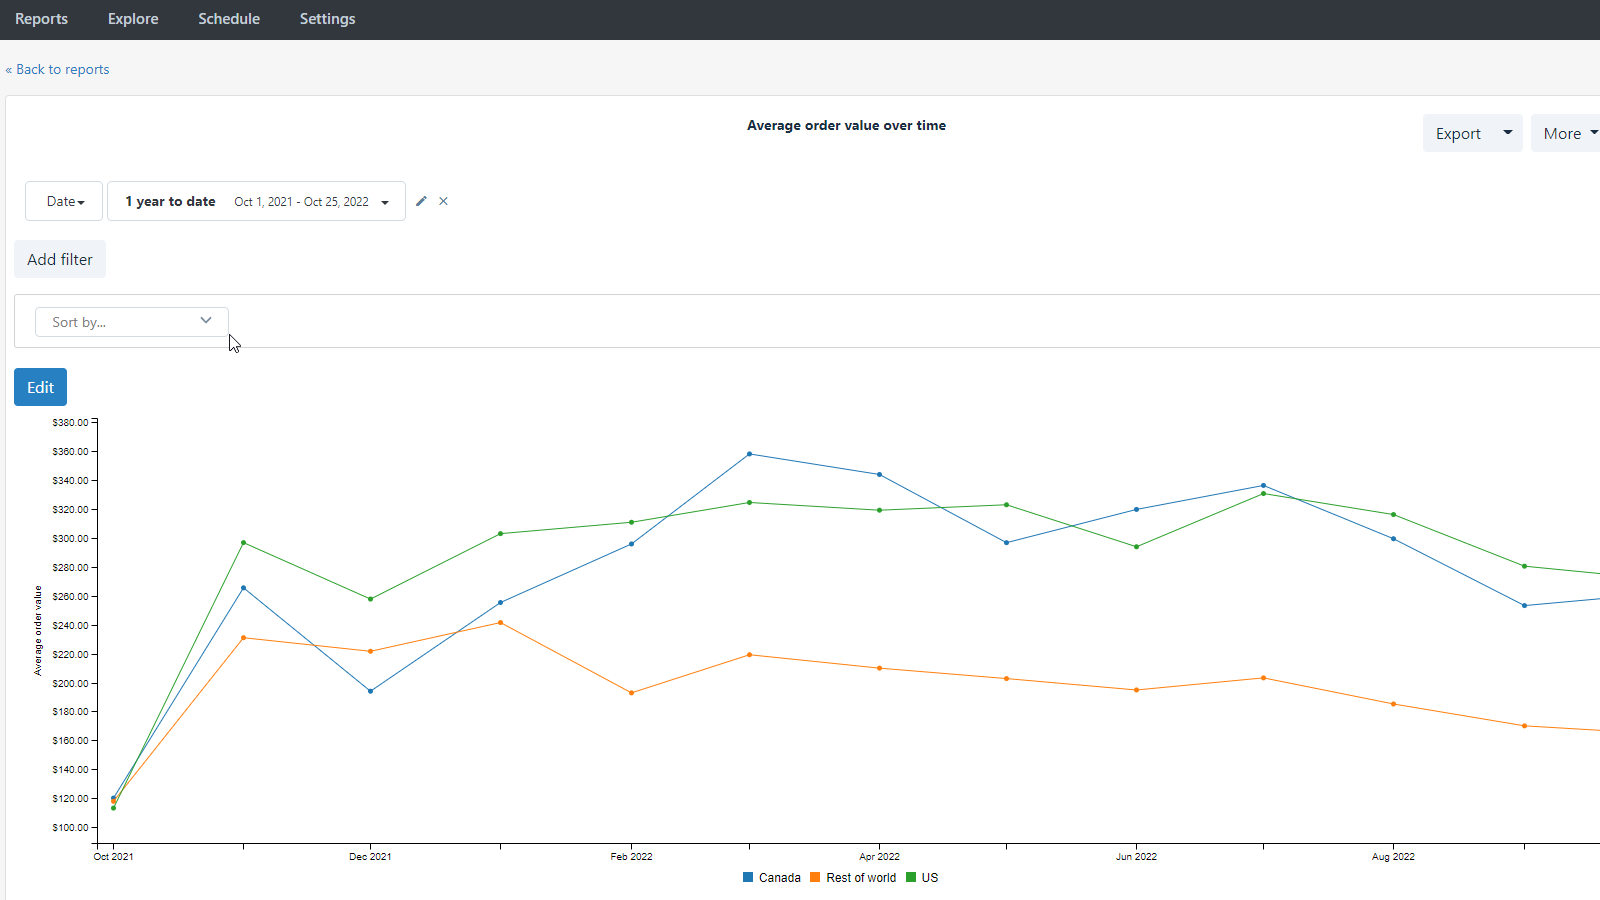
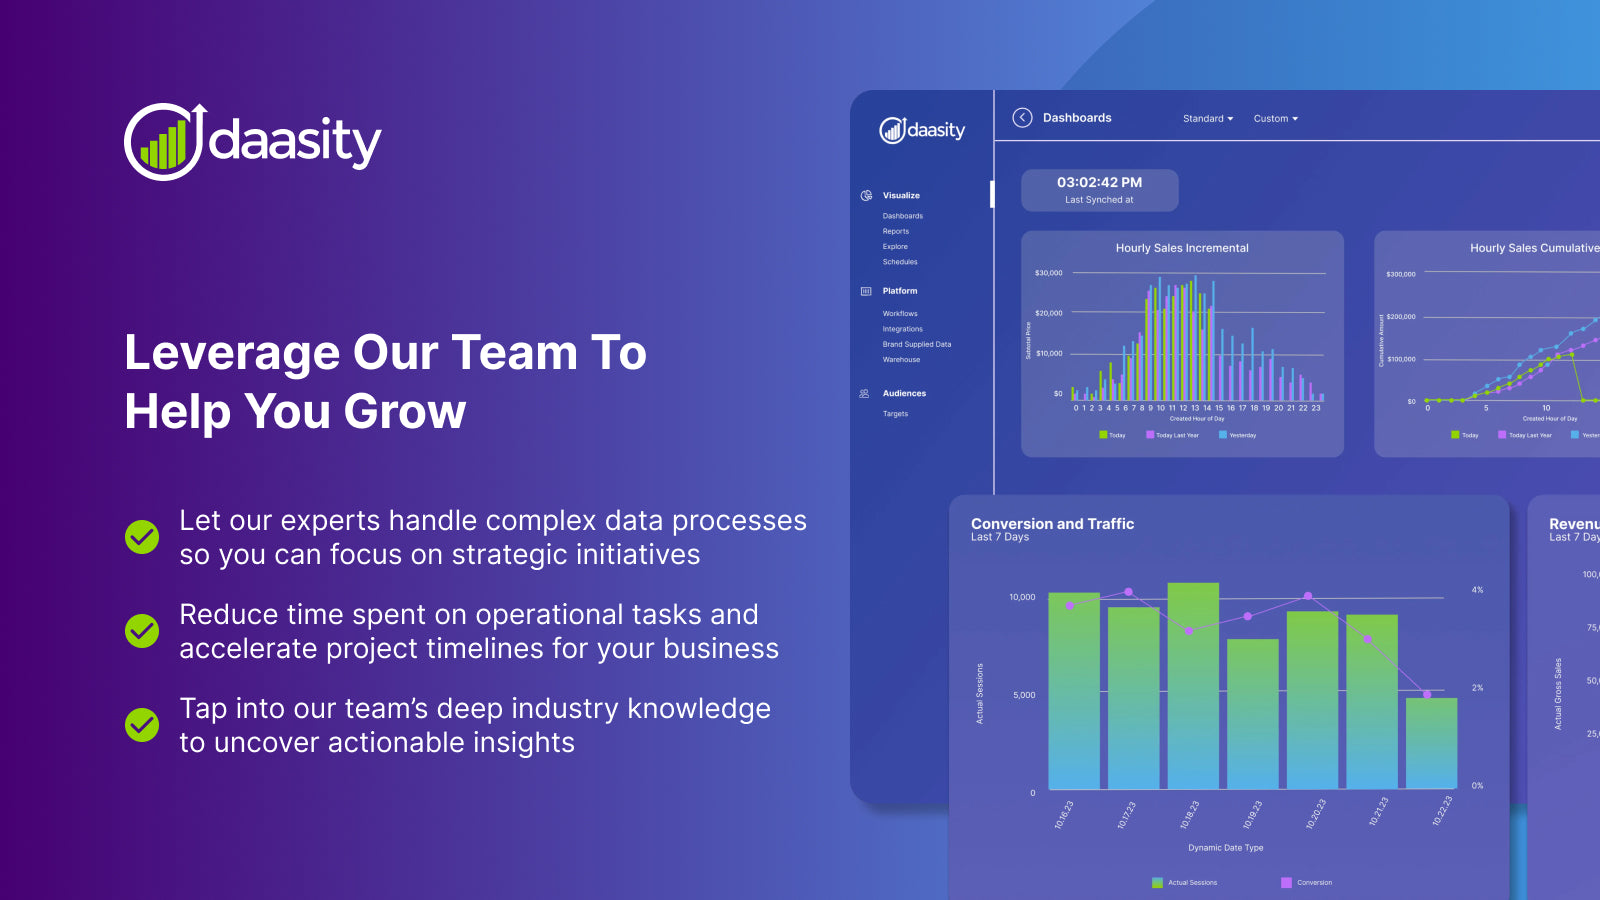
Reporting & analytics. Explore your data and automate reports.
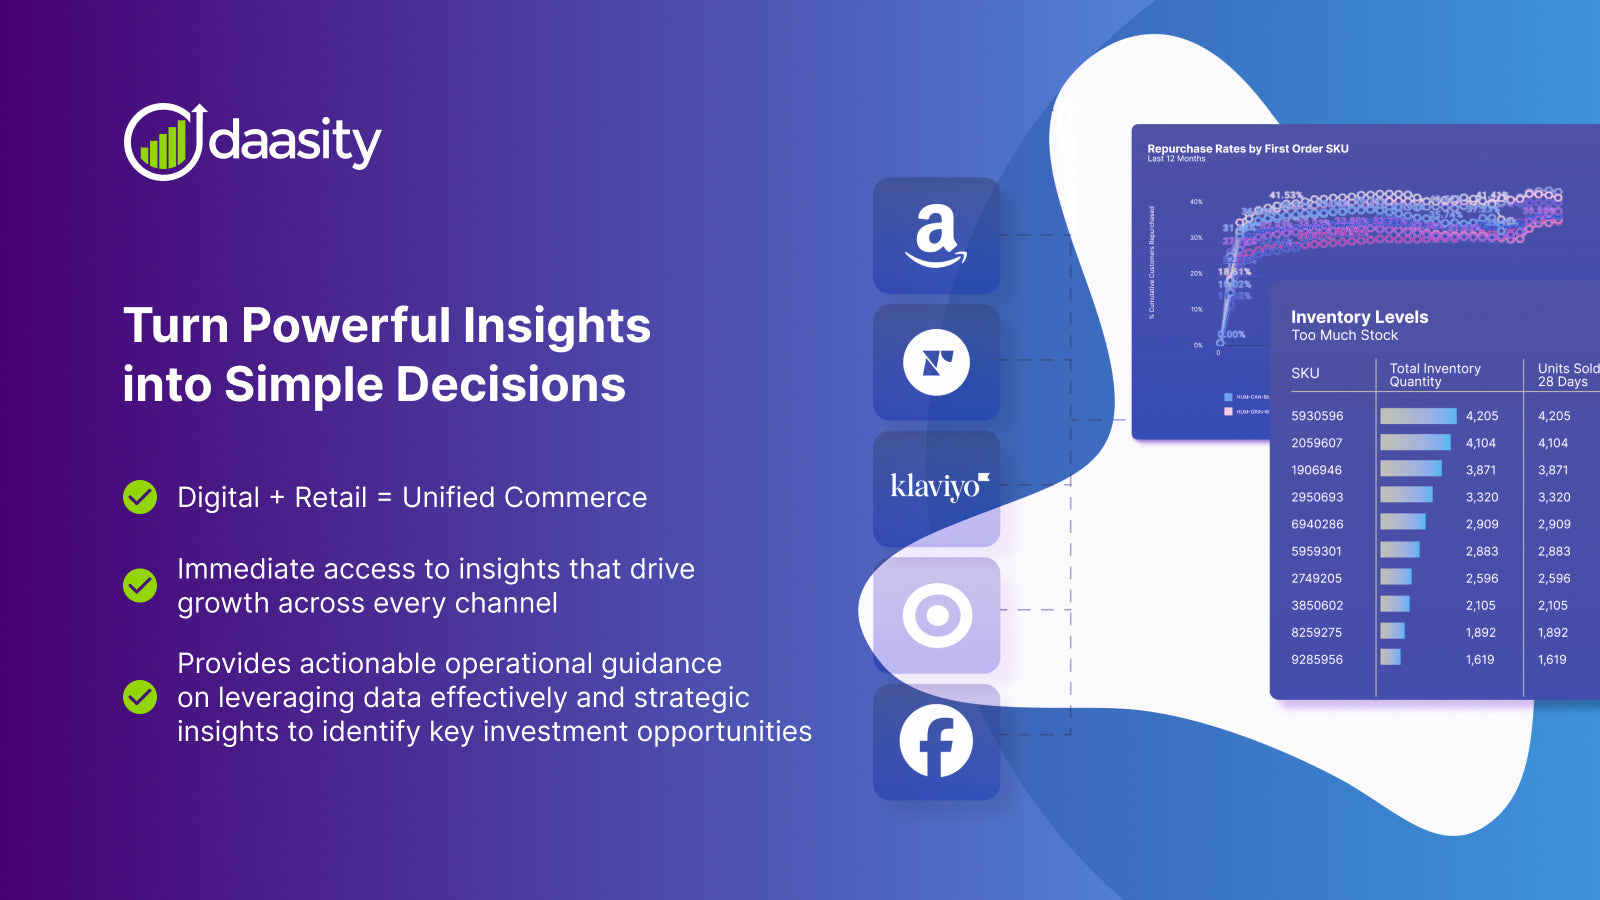
Simplified eCommerce analytics to quickly grow revenue
Reporting & analytics. Explore your data and automate reports.
Simplified eCommerce analytics to quickly grow revenue
1
Average Rating:4.9
Reviews:1,106
16460
Average Rating:2.4
Reviews:529,604