Where Knowledge Meets Innovation
Mixtable Analytics & Reports
"Real-time Shopify analytics in an intuitive spreadsheet interface."


About Mixtable Analytics & Reports
Built by Daipari EOOD
team@mixtable.com
Addressр-н Слатина, ж.к. Христо Смирненски, вх. А, ап. 21, София, 1579, BG
Website Privacy policy FAQIntroduction Video
Description
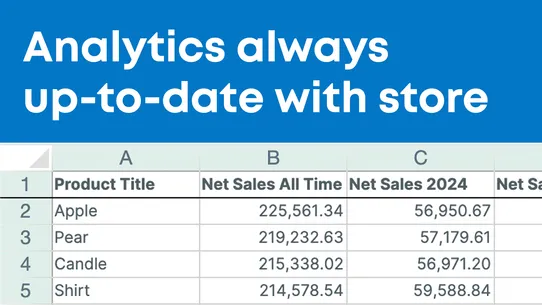
Mixtable Analytics is an online spreadsheet putting real-time store analytics at your fingertips
Mixtable Analytics & Reports brings real-time Shopify data into a familiar spreadsheet interface, eliminating manual exports and complex tools. Whether you run a small boutique or a large store, you get always-up-to-date insights on products, customers, and sales — no setup required. By simplifying reporting and automating updates, it helps you make faster, data-driven decisions so you can focus on growing your business.
- Store analytics in Excel-like online spreadsheet, with Excel-style formulas
- Analytics update in real-time as new orders are placed
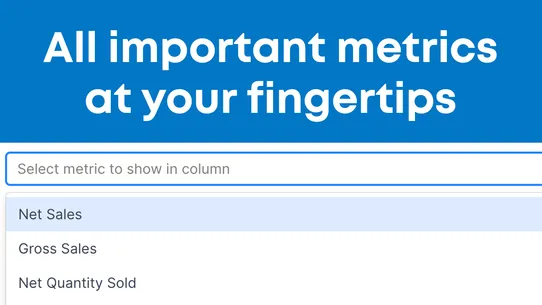
- Load analytics specific to a product, variant, collection, and more.
- Create reporting worksheets that show aggregate data for your store
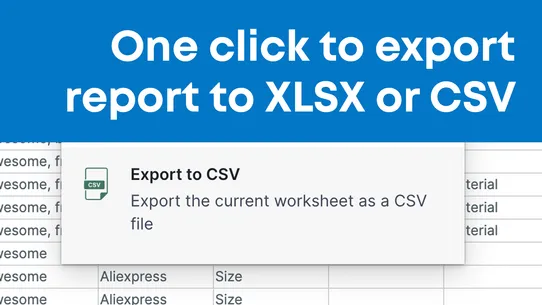
- Workbook can be easily exported to XLSX or CSV file
Pros
- Integrates real-time store analytics into a familiar spreadsheet interface.
- Benefits both small boutiques and large e-commerce businesses.
- Simplifies access to key metrics without the need for complex tools.
- Automates data updates and eliminates manual exports.
- Enables merchants to make faster, data-driven decisions.
- Focuses on growing the business by saving time on reporting.
- Features an Excel-like online spreadsheet with Excel-style formulas.
- Analytics update in real-time as new orders are placed.
- Workbook can be easily exported to XLSX or CSV file.
Cons
- Reliance on spreadsheet interface may not appeal to users preferring other data visualization tools.
- Real-time updates depend on stable internet connection.
- Limited to Shopify platform, not applicable to other e-commerce platforms.
- Potential learning curve for users unfamiliar with Excel-style formulas.
Key Features
More App like this
- Free Plan Available
Custom reporting and analytics. Export and download reports....
- Free Plan Available
Store Locator - Dealer Locator Page with Google Map
- Free Plan Available
Analytics to grow sales faster by understanding marketing