Where Knowledge Meets Innovation
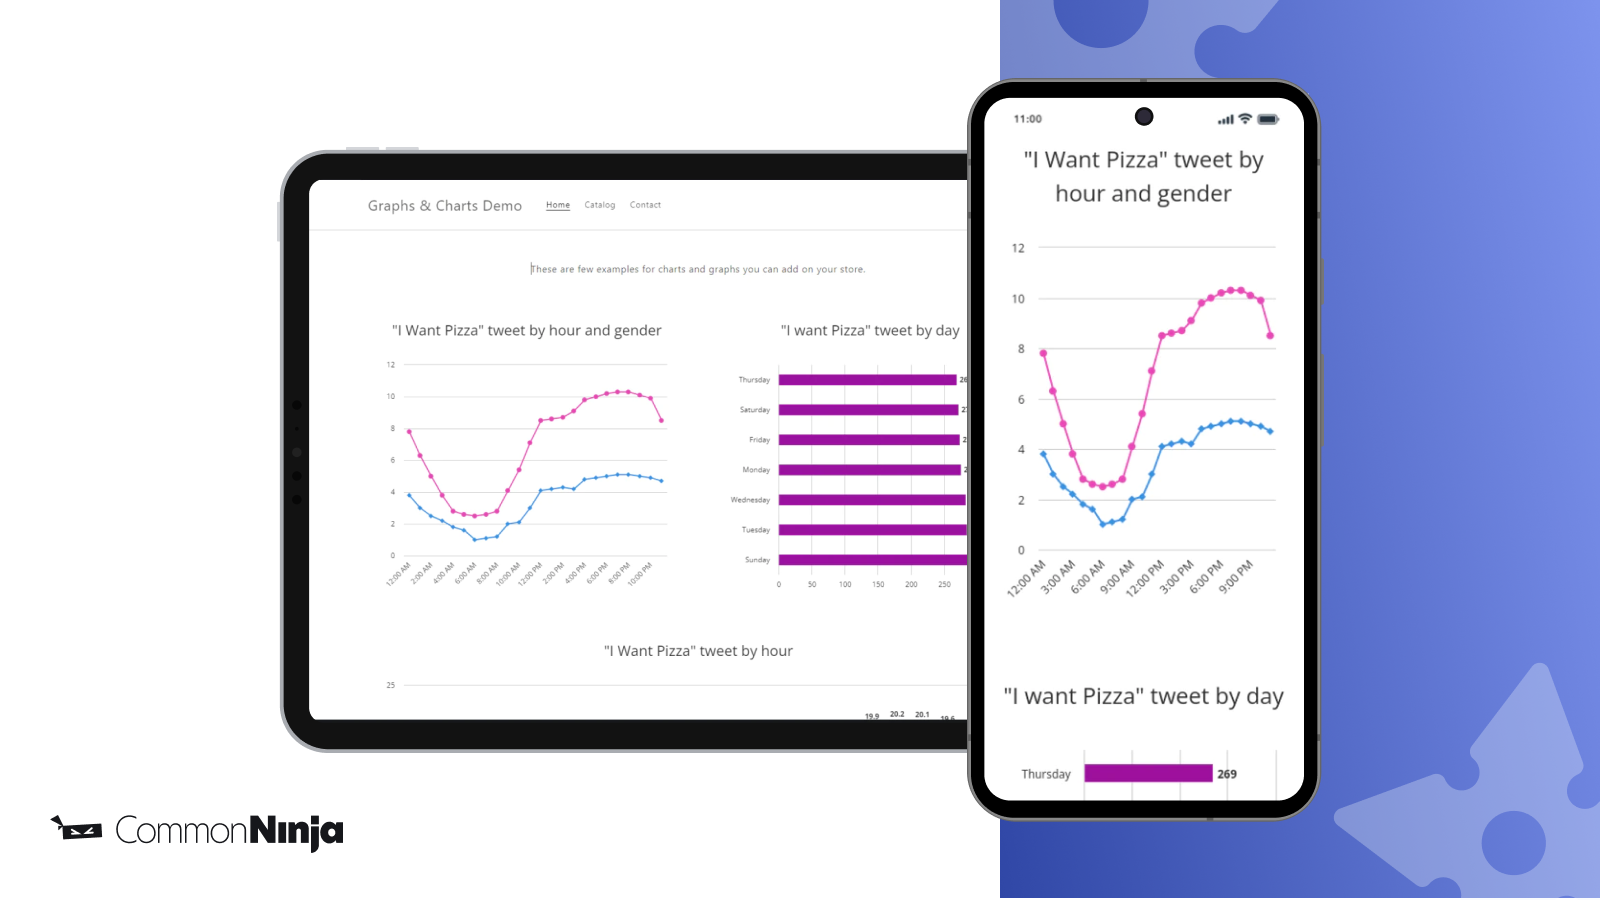
Powerful data visualization tool for creating graphs & charts
Launched Aug 11, 2021
Categories
151 O’Connor St, Ottawa, ON, ON, CA
Website Support Portal Privacy policy Tutorial FAQ DocumentTransform store data into visuals that sell. Create 20+ chart types, from bar to interactive pie, and place them anywhere in your store to grab attention and keep visitors engaged. Import from CSV or Google Sheets for instant updates, or connect live data sources for automatic refreshes. Customize colors, fonts, and layouts to perfectly match your brand. Ideal for product comparisons, tracking promotions, and showcasing customer reviews. Fully responsive, lightning-fast, and designed to turn b
Bundle of Apps To Increase Conversion, Boost Revenue &...
AI-powered SEO: Generate blogs, rewrite descriptions, and...
Increase your sales with smarter Related Products sections...
Treasure hunt. Coins and discounts for users. Free Plan...