Where Knowledge Meets Innovation
Save, compare price/solds & add badge - graph to product page.
151 O’Connor St, Ottawa, ON, ON, CA
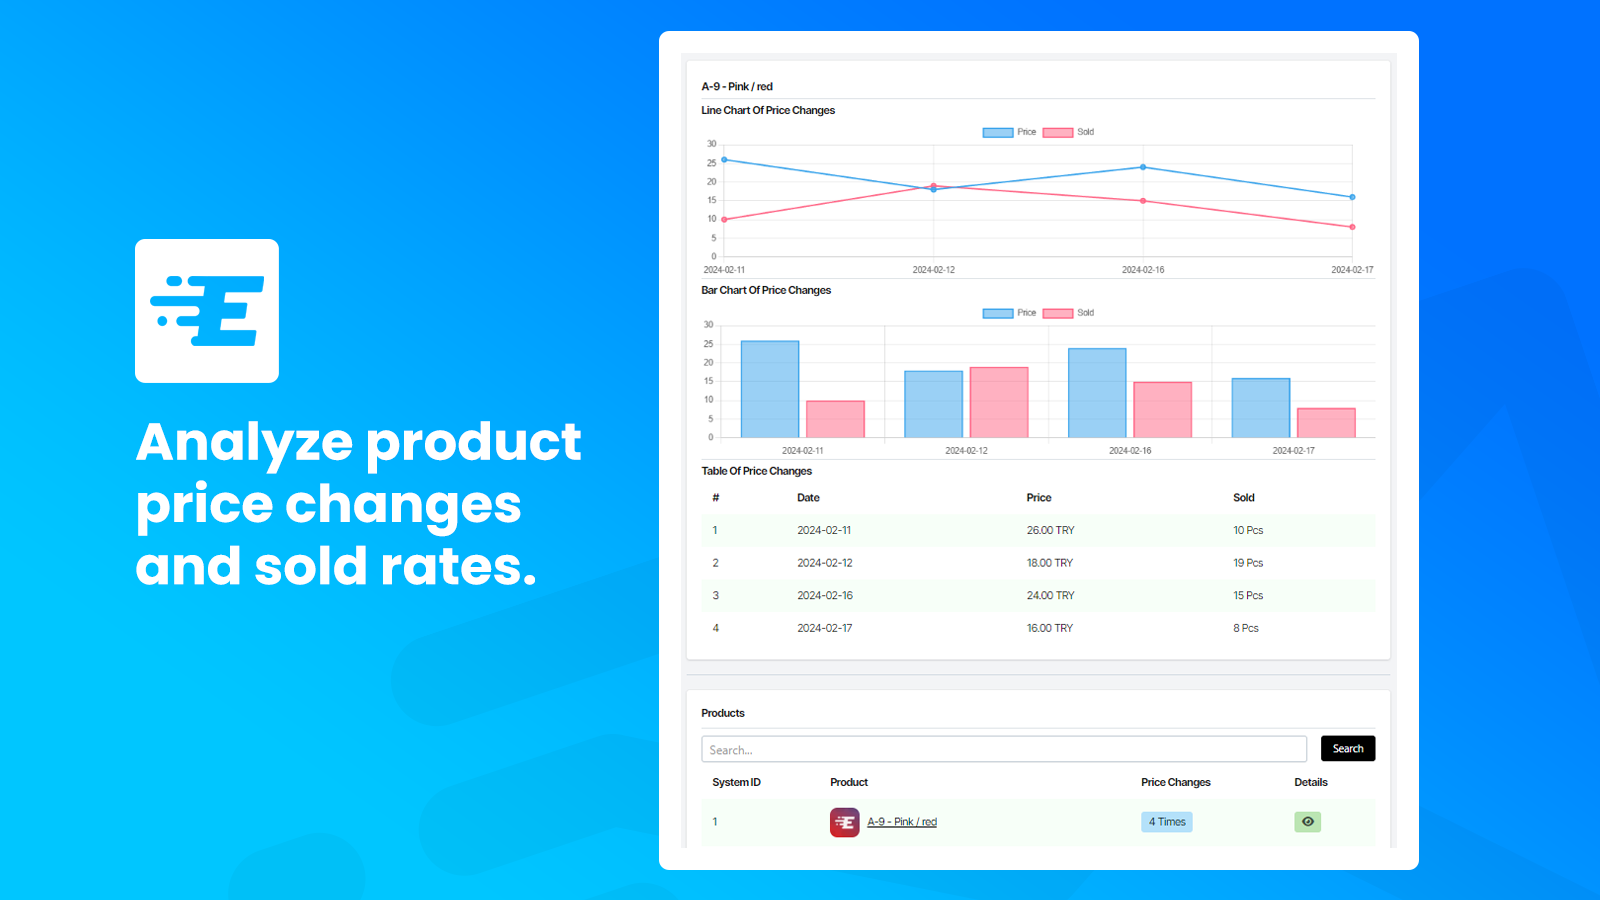
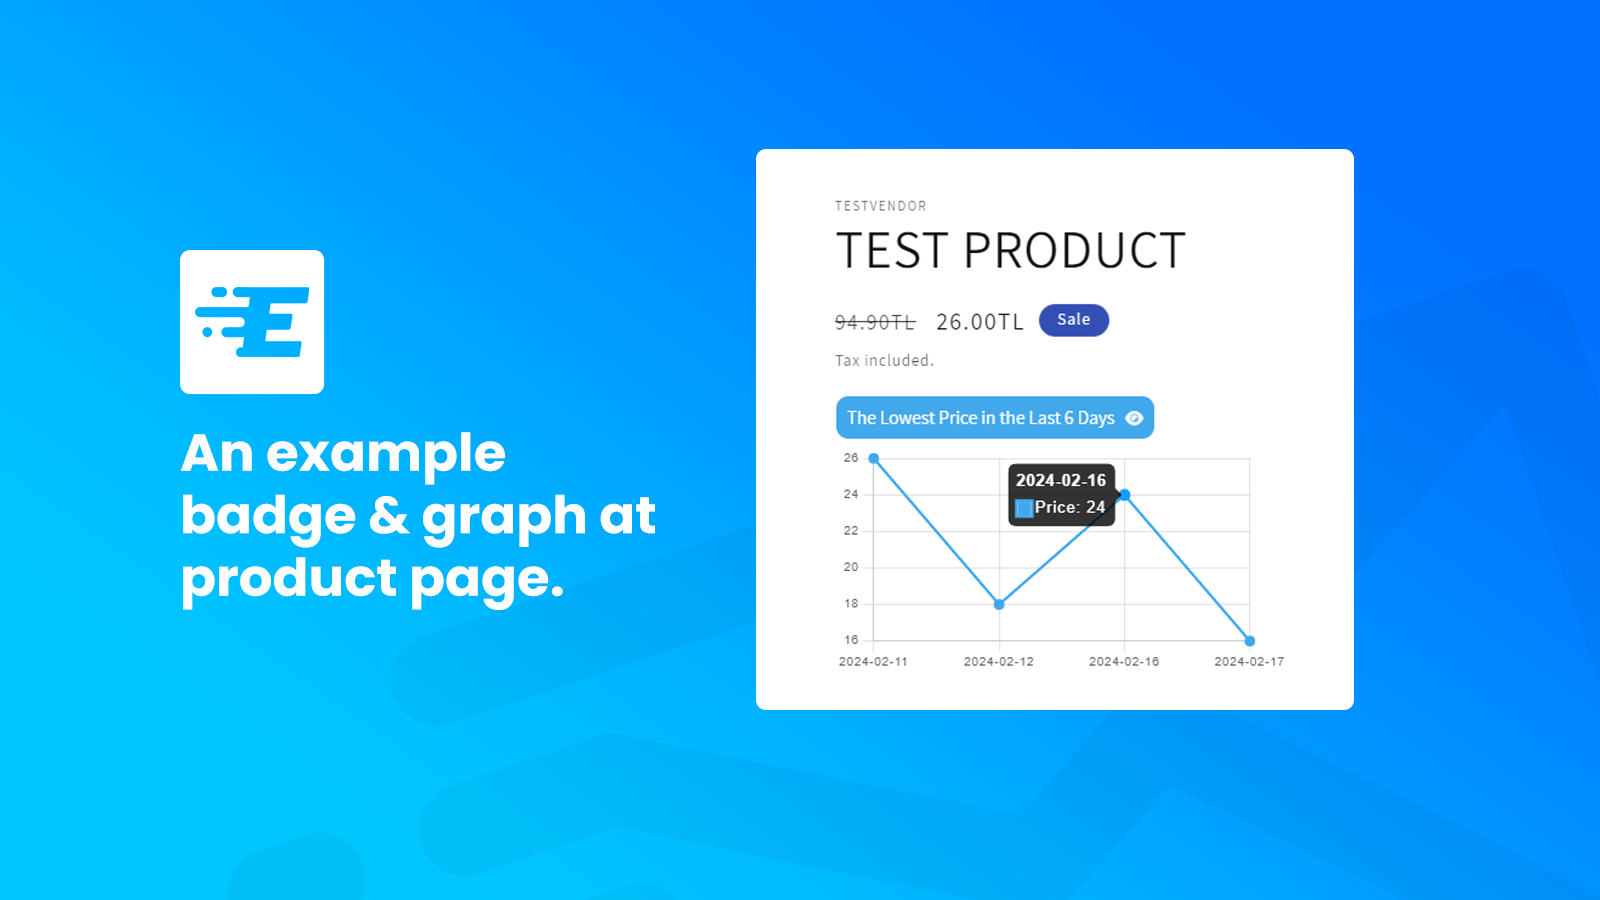
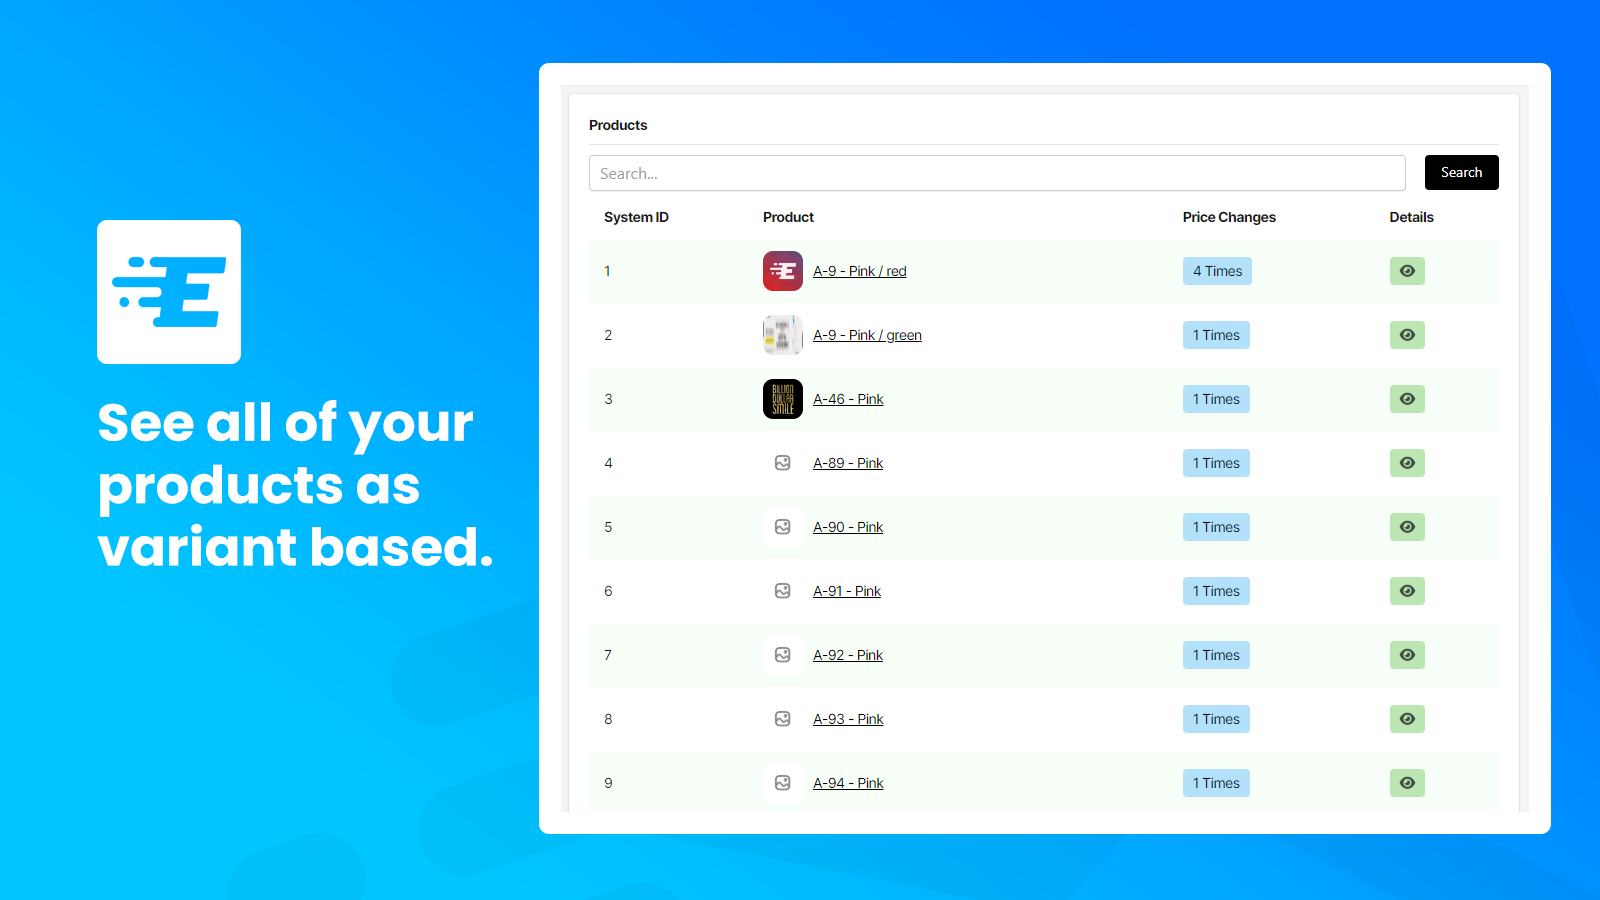
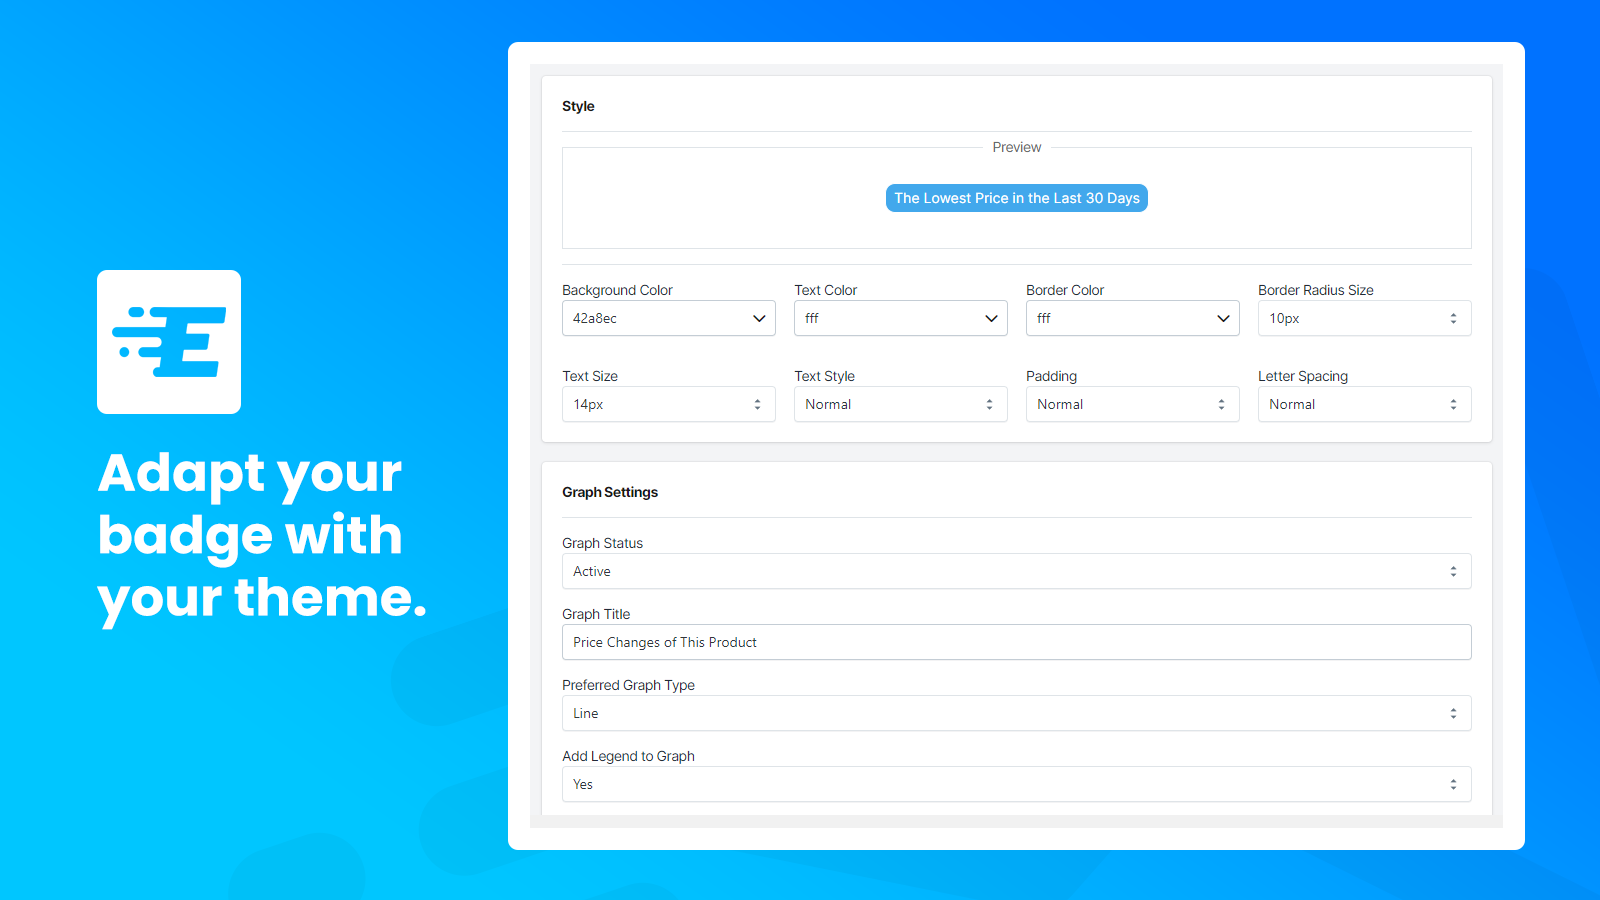
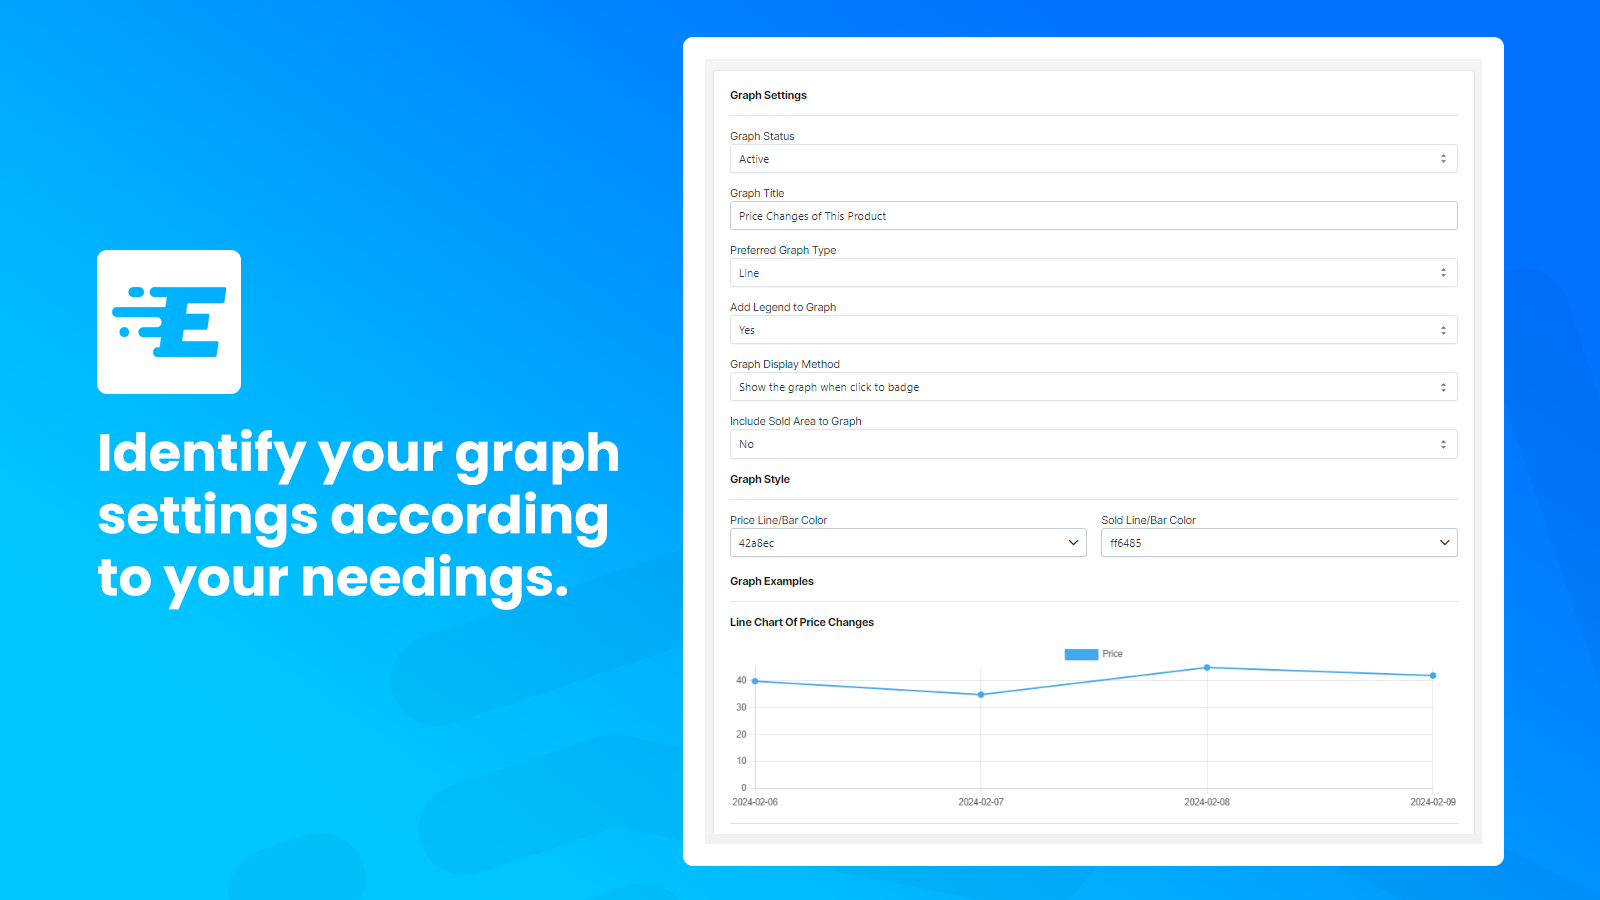
Website Support Portal Privacy policy Tutorial FAQ DocumentSaves your price changes and sales for each variant across different dates. It provides you with the opportunity to analyze this data through graphs and tables. Additionally, you can add labels to your product page, such as "Lowest Price in the Last 30 Days," Also, you can also add a price change graph to your product page. These graphs and labels can be fully customized to fit your store. Increase your sales by enabling your customers to better understand your discounts from their perspective!
Price editor for product discount & bulk discount pricing...
Retain current wholesalers. Offer volume tiered discounts
Streamline pricing for online and in-store sales with PriceMux....
Display products prices as intervals in collections and...