Where Knowledge Meets Innovation
Create interactive, customizable charts and graphs for engaging data visualization.
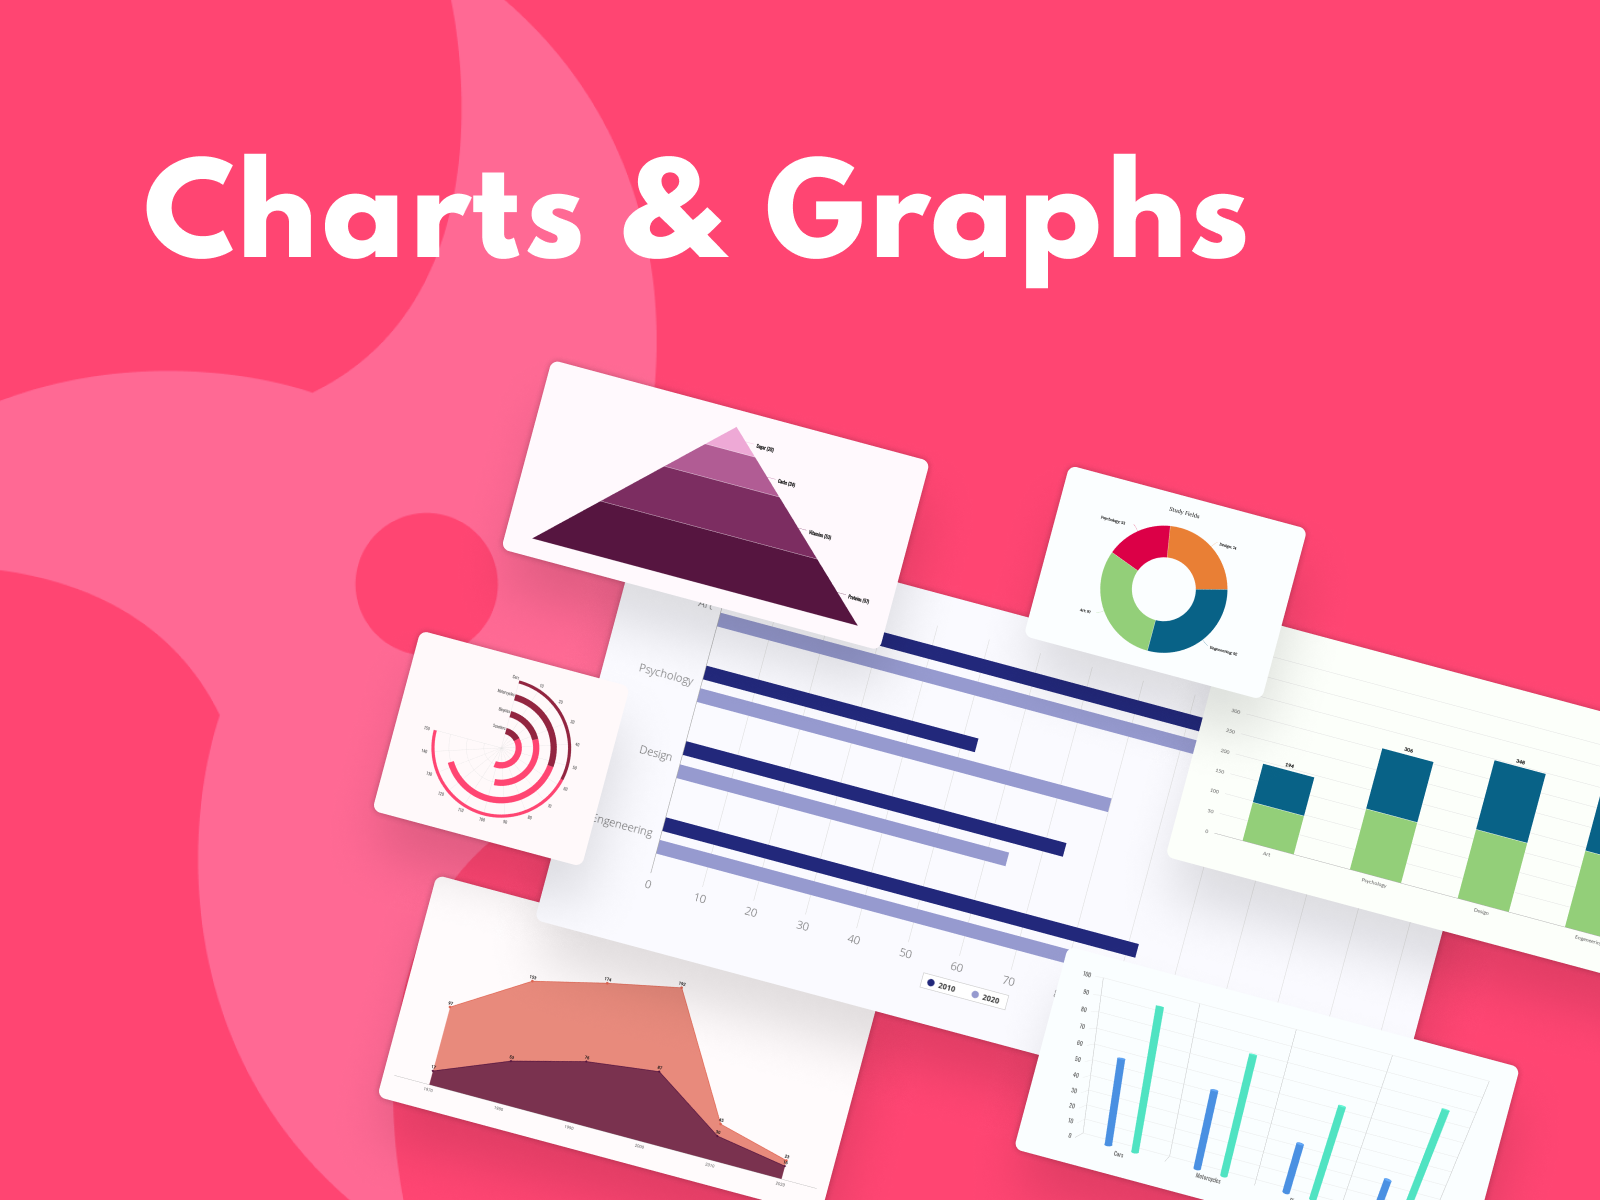
Charts & Graphs is a powerful data visualization generator that gives you the ability to create a great variety of charts and graphs with exceptional customizability.
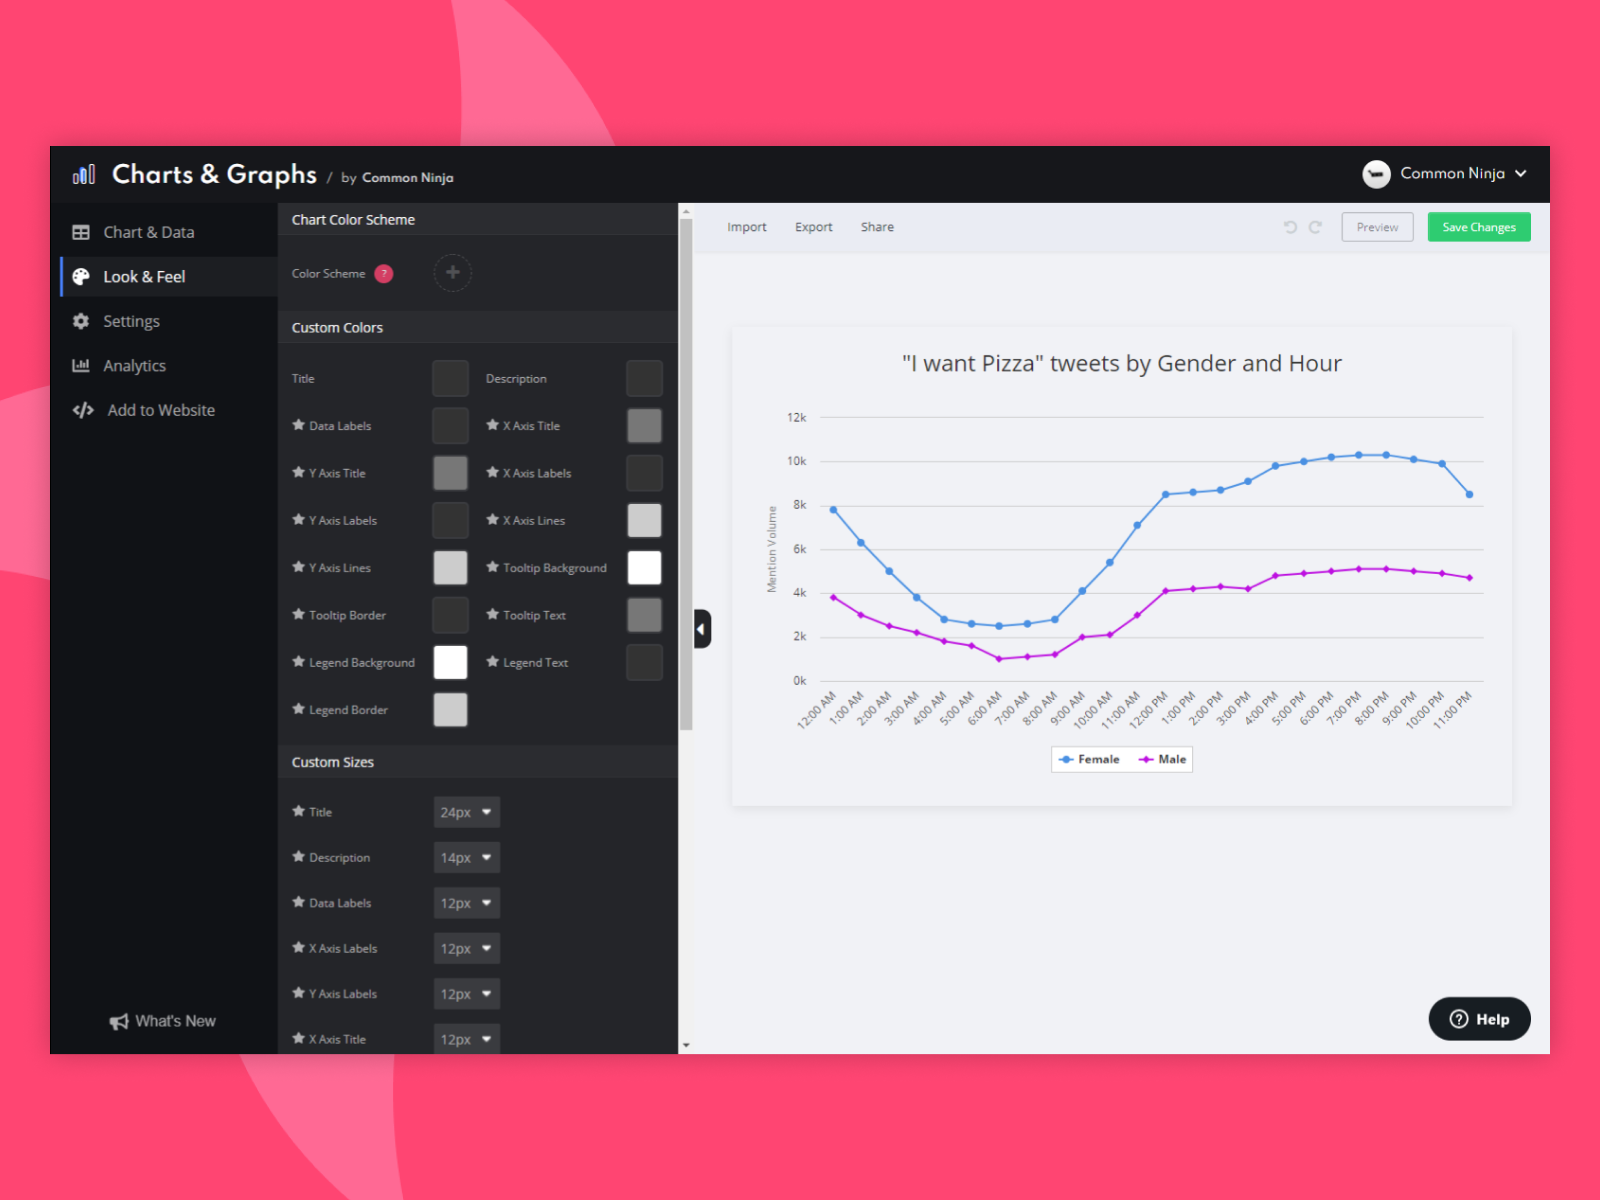
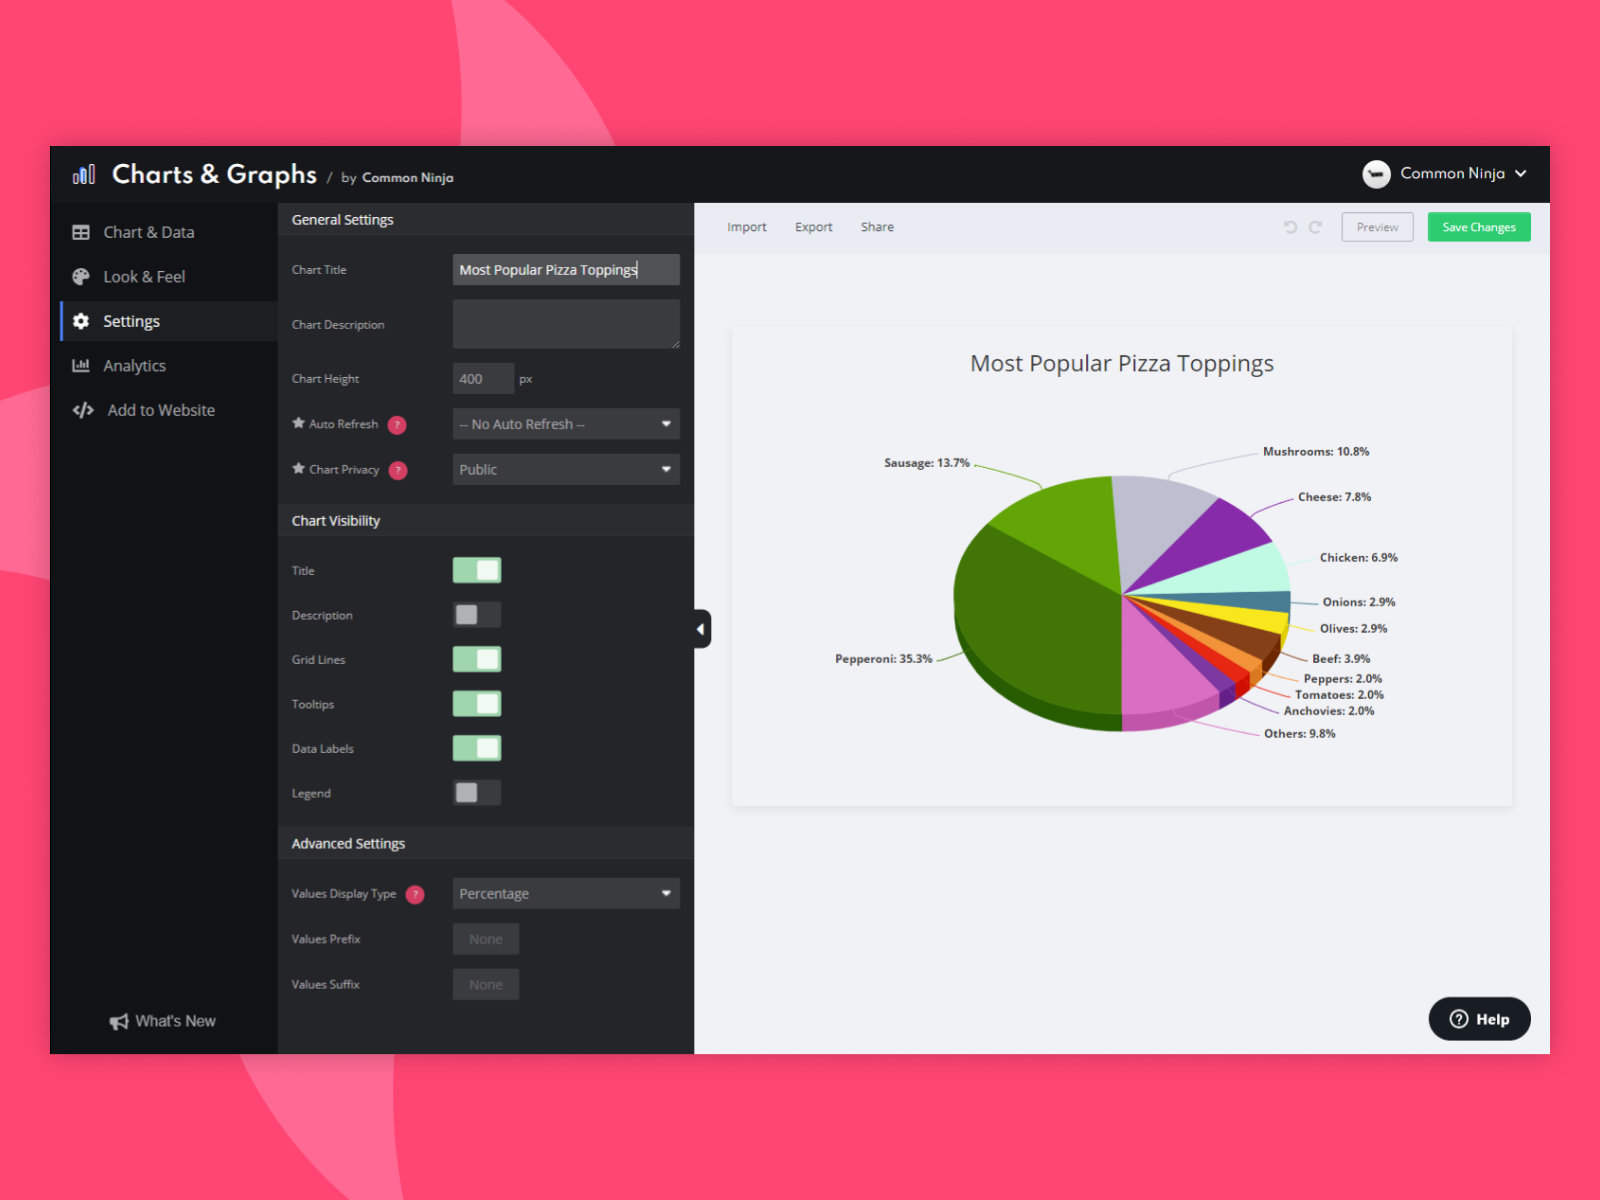
Data displayed in your store needs to be as engaging as possible so store visitors don't miss out on critical information. With Charts & Graphs, you can easily create and manage interactive and responsive charts and graphs on your store.
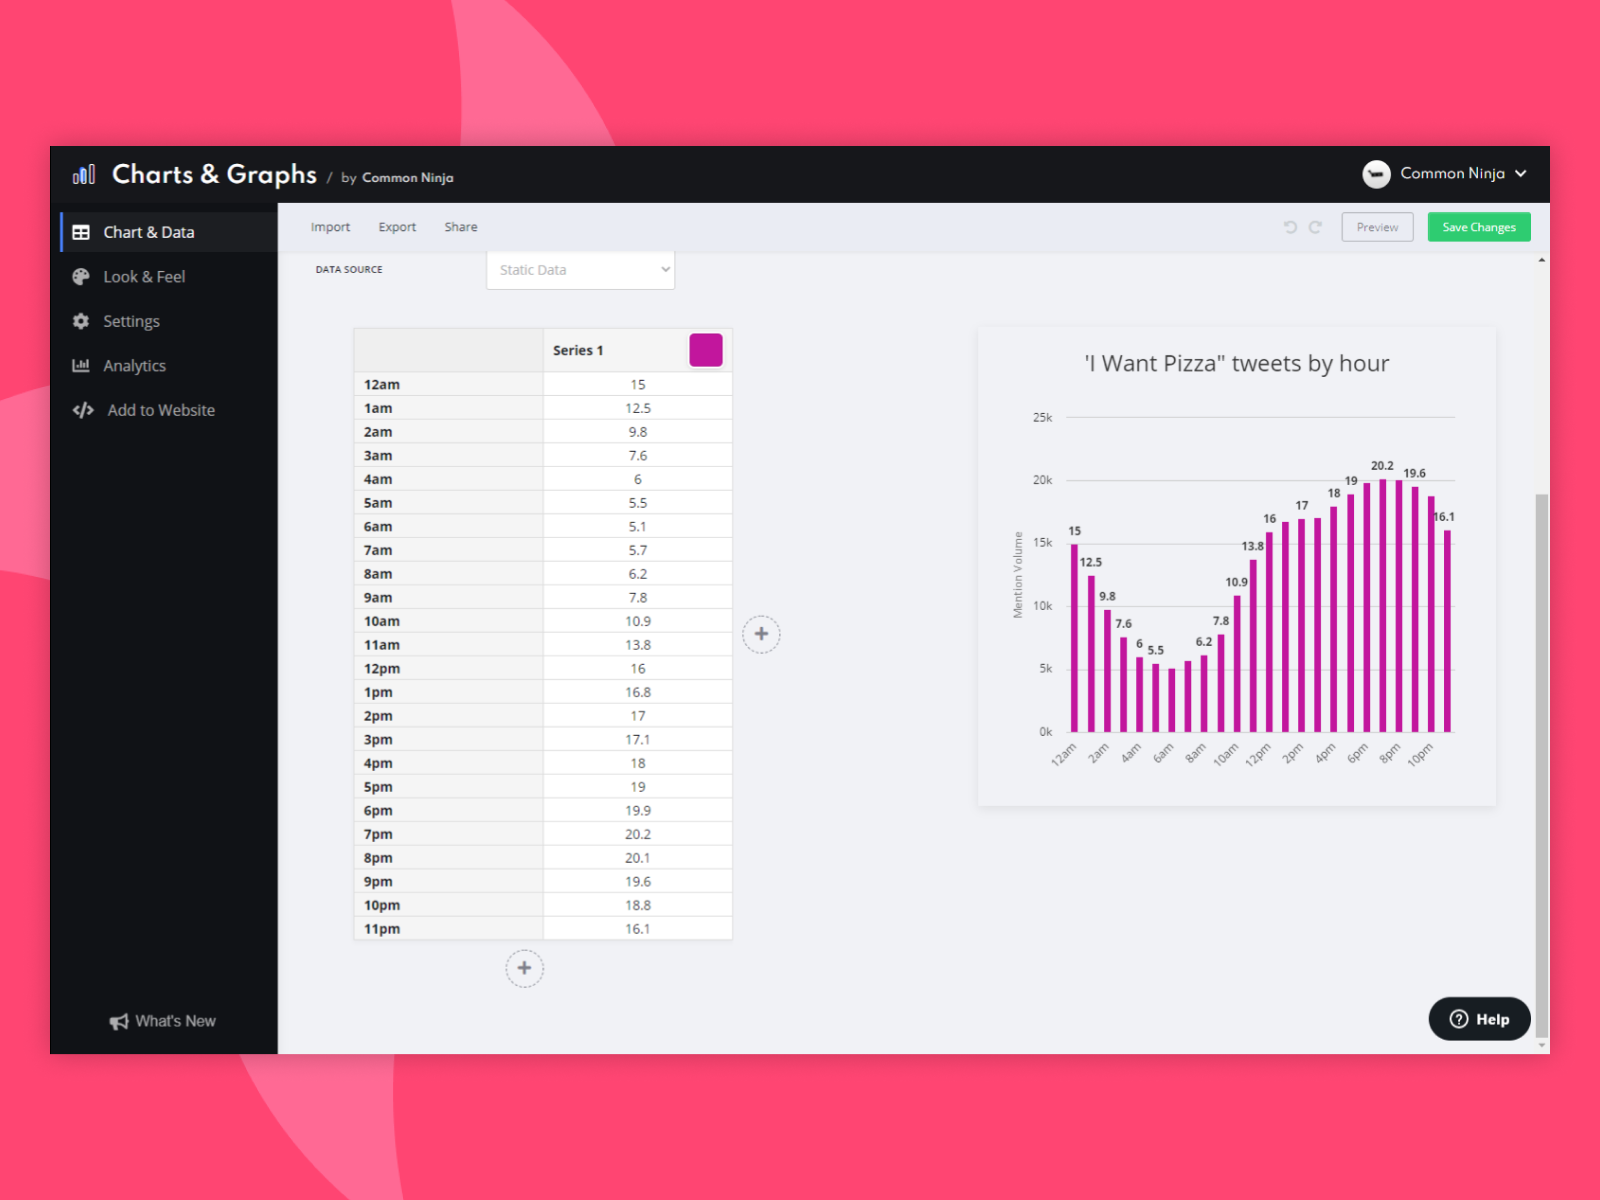
A spreadsheet interface lets you manage data sets from your store and display that data as a beautiful chart or graph.
Streamline Walmart Canada's inventory, orders, and pricing...
Discover stores easily with our modern, user-friendly locator...
Create customizable and secure forms to boost engagement...