Taranker.Com Logo

Send this list to my inbox

By proceeding, you agree to our Terms Of Conditions and Privacy Policy.
Your request is being processed and will be delivered shortly. If you do not receive an email from Taranker within the next 5 minutes, please check your spam folder and mark it as "Not Spam" to ensure future emails reach your inbox.
Size Charts cover
Size Charts is an essential app for online retailers aiming to enhance customer satisfaction and reduce return rates by simplifying the sizing process. With this app, you can create and personalize size charts in minutes, choosing from three pre-made templates or crafting your own to fit any product's unique requirements. Its intuitive setup ensures seamless integration with your store's product pages, allowing you to effortlessly manage and update multiple size charts, maintaining consistency and organization. The app's fully customizable size chart button blends flawlessly with any store design, ensuring a polished and professional look. By providing clear and reliable sizing information, Size Charts streamlines the shopping experience, making it easier for customers to find the right fit. This ultimately improves shopping efficiency and supports online stores in reducing costly returns.

By PurpleBear

  • $5-$16 / Month
6 Reviews
Size Chart cover

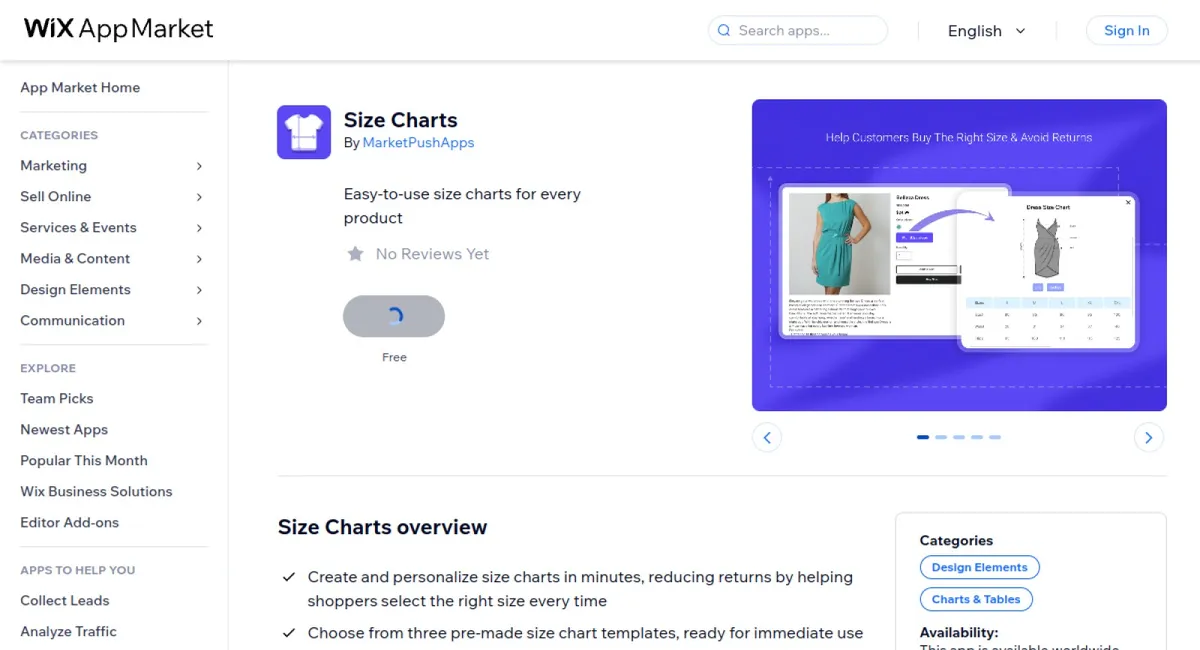
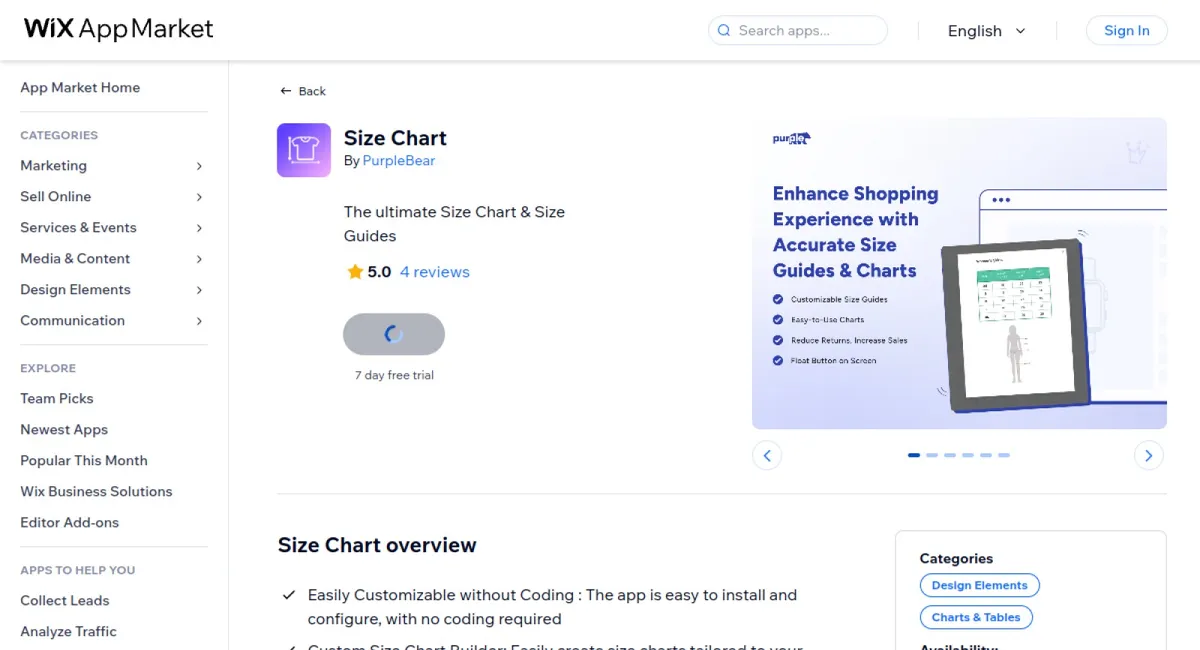
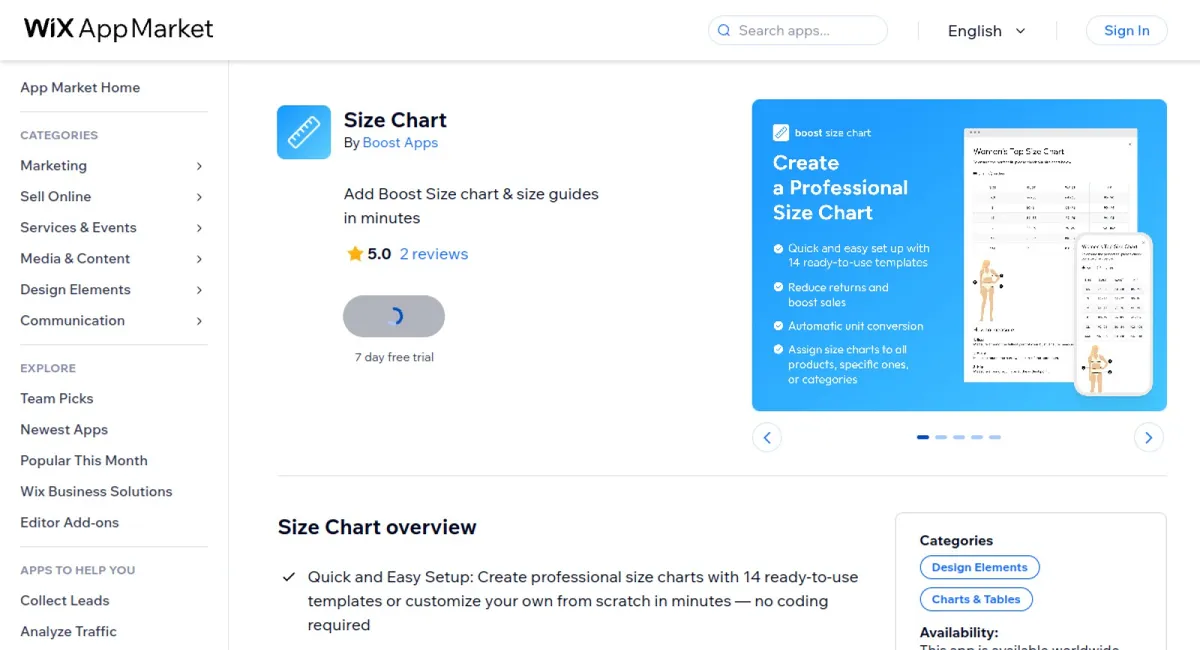
Size Chart is a user-friendly app designed to enhance the online shopping experience by providing accurate and customizable size guides for various products like clothing, shoes, and accessories, without the need for coding skills.

  • Easily Customizable without Coding: The app can be installed and configured effortlessly without any coding experience.
  • Custom Size Chart Builder: Allows users to create personalized size charts tailored to specific products.
  • Fully Mobile Responsive: Ensures the size chart widget works seamlessly across all devices, enhancing user experience.
  • Fit Guide Creator: Enables the addition of detailed measurement guides to assist customers in selecting the correct size.

Outstanding reviews highlight the app's ability to significantly reduce size-based returns, thereby increasing customer confidence and satisfaction. Users commend its ease of use, comprehensive features, and the smooth, effortless shopping experience it creates, making it an invaluable tool for any shop owner looking to improve sales and reduce size-related issues.

By Boost Apps

  • $4.49 / Month
4 Reviews
Size Chart cover
Size Chart is your go-to app for creating professional size guides without the need for coding knowledge. With 14 ready-to-use templates and the option to build your own from scratch, setting up a size chart is both quick and easy. By providing clear and stylish size charts, the app helps customers confidently select the right size, keeping them engaged on the product page through a convenient pop-up display. The app features intuitive customization options, including automatic unit conversion between centimeters and inches, and allows you to assign size charts to individual products, specific categories, or your entire store. With its responsive design, size charts look fantastic on both mobile and desktop devices, enhancing the user experience. By reducing sizing confusion, the app minimizes returns and abandoned carts, ultimately boosting sales. Elevate your store's customer satisfaction and profitability with Size Chart's flexible, user-friendly tools.
(2.8/5)
31 Reviews
Common Ninja Charts & Graphs cover

Common Ninja Charts & Graphs app allows users to create a variety of visually appealing and interactive charts with ease. It supports multiple data sources, offers extensive customization options, and is incredibly user-friendly, making it suitable for users with no coding background.

  • Large Selection of Chart Types: Offers 20 different types of charts to effectively represent data.
  • Multi-Source Data Import: Allows conversion of CSV files to interactive charts and connects to remote URLs.
  • Endless Design Options: Provides comprehensive customization for controlling every design element.
  • Ease of Use: Features an intuitive drag-and-drop dashboard that requires no coding knowledge.
  • Responsive Design: Seamlessly adapts to various screen sizes for optimal viewing.

Users highly appreciate the app's versatility and ease of use, often highlighting its intuitive interface and extensive customization options. The ability to import data from various sources and the wide array of chart types available are particularly praised. Reviews frequently mention the app's capacity to enhance user engagement and improve decision-making by presenting data in an aesthetically pleasing and accessible manner.
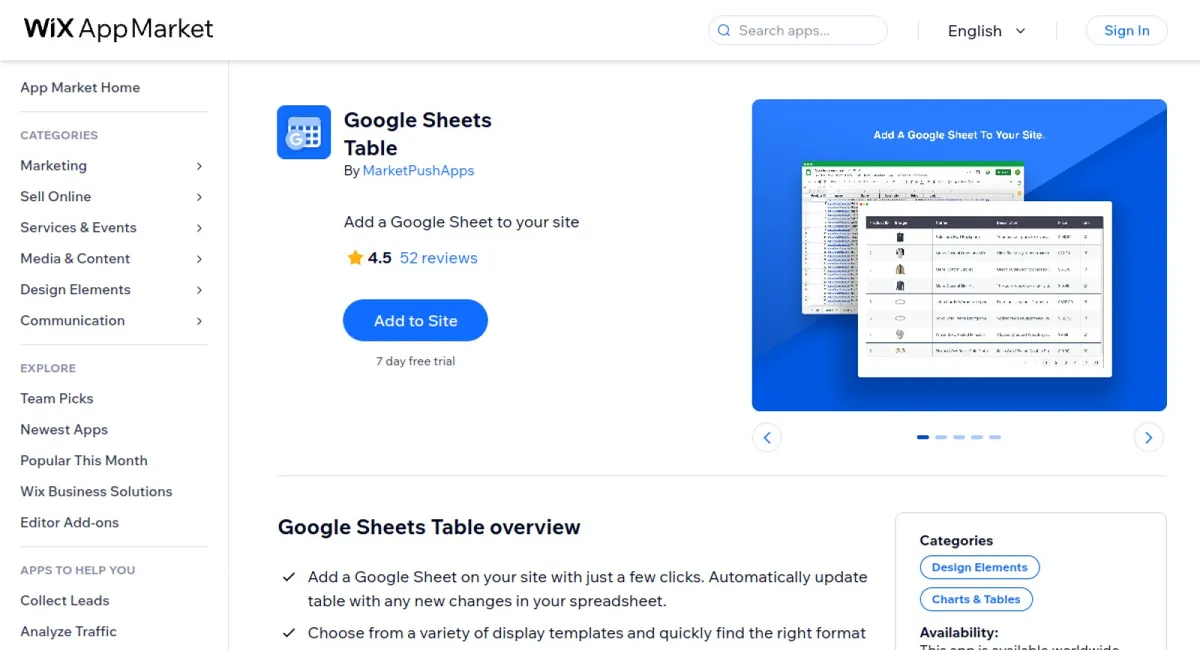
1 Reviews
Donut Chart cover
Introducing "Donut Chart" – a powerful app designed to enhance your website’s data presentation through stunning and customizable donut charts. This versatile tool allows you to effortlessly add, modify, and style donut charts to perfectly match your site's aesthetics. With four different chart types available, you can create visually appealing data presentations that captivate your audience. The app features dynamic data management, enabling you to update data points and values with ease, keeping your charts informative and relevant. Seamlessly integrate these charts into your website, ensuring they blend harmoniously with your existing design. The user-friendly interface makes it simple to add new segments and adjust data, even for those without extensive technical expertise. Elevate your data visualization capabilities with "Donut Chart," the ideal solution for website owners seeking to present complex data in an engaging and accessible manner.
(3/5)
2 Reviews
Pie Chart PRO cover
Pie Chart PRO is a powerful and user-friendly tool designed to effortlessly create visually appealing pie charts. With its intuitive setup, you can easily configure partition data, set hover labels, and adjust the chart's size to seamlessly fit your site's design. Personalize your chart by adding optional images to partitions and leverage the dynamic legend feature to enhance data comprehension. The app's responsive design ensures a smooth user experience across both mobile and desktop devices, with customizable views that maintain clarity and functionality. For developers and advanced users, Pie Chart PRO offers robust integration capabilities, allowing you to connect your chart to an API or use Velo for dynamic data updates, perfect for real-time analytics and user-generated content. Whether you're looking for a simple visualization tool or a sophisticated chart with advanced customization, Pie Chart PRO is the ideal solution to transform complex data into an engaging visual story.
(2.6/5)
775 Reviews
Table Master cover

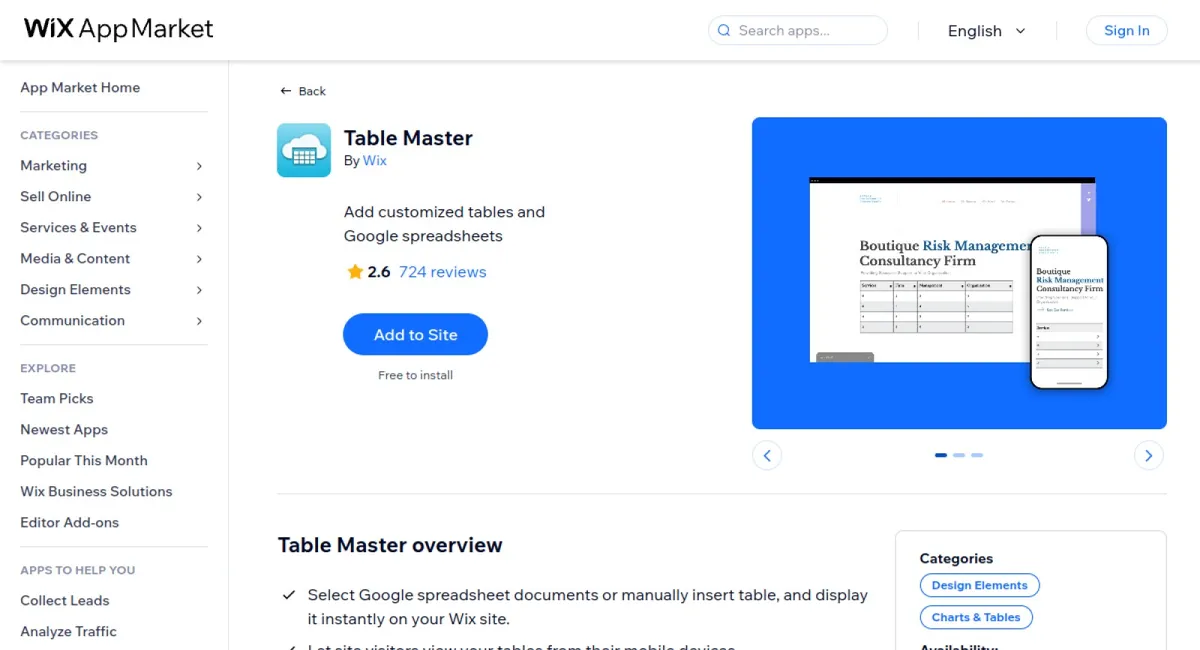
Table Master is a versatile app designed for seamlessly integrating tables into your Wix site. Effortlessly select Google spreadsheet documents or manually insert tables and display them instantly. This tool allows you to design and customize tables, ensuring they match your site's aesthetic, while automatically updating content with any changes.

  • Google Spreadsheet Integration: Quickly select and display Google spreadsheet documents directly on your Wix site.
  • Mobile Optimization: Enables site visitors to view and interact with tables from their mobile devices smoothly.
  • Customizable Design: Offers a range of design options to ensure your tables align with your site's unique look and feel.
  • Automatic Data Updates: Automatically updates data on your site with every modification made to your tables, ensuring information is always current.
  • Versatile Usage: Use tables for organizing content, creating lists, sorting contacts, updating data, and more, enhancing site functionality.

Table Master has been praised for its user-friendly interface and seamless integration with Wix. Users appreciate the effortless synchronization with Google spreadsheets, its adaptability across different devices, and the customization options available. The app is highly rated for efficiently updating site content, providing flexibility, and enhancing the overall visitor experience with organized and visually appealing tables.

(1.6/5)
2 Reviews
Charts and Graphs cover
Introducing "Charts and Graphs" – the ultimate tool for seamlessly integrating interactive and dynamic charts into your website with no coding required. This app simplifies the process of turning raw data into visually appealing graphics, supported by a user-friendly interface. Choose from a variety of chart types, such as pie charts and bar graphs, and easily connect them to your site’s data collections. Perfect for bloggers, business owners, educators, and data enthusiasts alike, "Charts and Graphs" transforms your website into a visual storytelling platform. With just a few clicks, you can bring your data to life and capture your audience's attention. Experience the power of compelling data visualization by trying "Charts and Graphs" today.
Numbers: Show Animated Stats cover
Numbers: Show Animated Stats is an innovative app designed to transform the presentation of numerical data, making it both engaging and visually compelling. With its real-time number animation feature, you can create seamless and captivating transitions that bring your statistics to life, instantly capturing your audience's attention. The app also includes an interactive progress bar, allowing you to dynamically track progress or completion, adding a captivating element to your presentations. Users can customize their animated statistics with a variety of styles, colors, fonts, and backgrounds, ensuring your data aligns perfectly with your brand or presentation theme. Whether you're showcasing business metrics, educational data, or personal achievements, Numbers: Show Animated Stats offers a powerful way to elevate and personalize your data presentations.
Business Hours & Open Sign cover
The "Business Hours & Open Sign" app is a dynamic tool designed to ensure your customers always have accurate information about your business hours. By automatically updating your open and closed status based on real-time data, it prevents confusion and enhances customer experience. The app offers extensive customization options, allowing you to adjust colors, fonts, and labels to seamlessly integrate with your website's branding. With a selection of professionally designed templates, you can choose the perfect style to match your business’s aesthetic. Whether you need to mark specific hours for each day or indicate days when your business is closed, this app makes it effortless to keep your visitors informed. Enhance your business's online presence and operational transparency with this comprehensive, real-time hours display solution.
(1/5)
1 Reviews
Chart and Graph Builder cover
Chart and Graph Builder is an intuitive app designed for users who need to easily create and customize professional-looking charts and graphs. It offers support for 13 popular chart types, including Pie Charts, Multi Axis Line Charts, and Radar Charts, allowing you to present your data in a visually compelling manner. The app enables the addition of multiple datasets to charts such as line, radar, and bar charts, providing a comprehensive analysis tool for varied data. With its user-friendly interface, crafting a chart is as simple as selecting your preferred chart type, adding it to a section or grid, inputting your datasets, and customizing the design to your liking. You can adjust elements like chart height, dataset colors, and labels, ensuring that the chart fits seamlessly into your layout. Built with SEO optimization and high performance in mind, this app ensures that your data presentation is both aesthetic and efficient. Whether you're a beginner or an expert, Chart and Graph Builder makes data visualization quick and straightforward.
(1/5)
1 Reviews
Timeline Chart cover
"Timeline Chart" is a powerful app designed to elevate your site's data visualization with customizable and stylish timeline charts. Effortlessly add, modify, and style your charts to match your site's design using a user-friendly interface that requires no extensive technical skills. With three methods for updating data—manually through a simple panel, via API, and using Velo—you can ensure that your charts always display the most current and relevant information. Seamless integration allows these charts to blend harmoniously with existing site aesthetics, enhancing your brand's visual appeal. The app's dynamic data management feature makes it easy to keep your audience informed with the most critical data points. Whether you're a seasoned developer or a site owner with limited technical knowledge, "Timeline Chart" empowers you to present complex data clearly and engagingly. Enhance your data presentations today with the versatile and user-friendly capabilities of "Timeline Chart."
(1/5)
4 Reviews
Numbers & Stats Counter cover
Numbers & Stats Counter is a powerful app designed to transform your website's numerical data into visually captivating experiences. With engaging count-up animations, this app grabs your audience's attention by bringing static numbers to life, creating a memorable and dynamic user experience. Choose from 15 customizable templates tailored for various industries such as restaurants, fitness studios, and local retail stores to perfectly align with your brand's unique aesthetic. The app also features iconic visuals that enhance data comprehension, using intuitive icons to make complex information easily digestible. By incorporating this solution, you not only captivate your audience but also provide them with meaningful data insights. Elevate your online presence with Number Counter and engage your visitors like never before.
Our Timeline cover
Our Timeline is an innovative app that offers a dynamic way to showcase your story through a visually engaging widget. The app allows users to easily add and customize entries with editable titles and descriptions, creating a personalized narrative. With its smooth, scroll-triggered animations, Our Timeline captures audience attention and enhances storytelling. The app is fully responsive, ensuring it looks great on any device, while offering style customization options for fonts, colors, and backgrounds to align with your brand identity. Ideal for displaying historical events, project milestones, or personal accomplishments, Our Timeline turns ordinary data into an interactive visual experience, making it perfect for both personal and professional use. Transform your stories into a compelling visual journey with ease and creativity using this versatile tool.
(1.3/5)
3 Reviews
StatTrack cover
StatTrack is your go-to tool for dynamic and interactive data visualization on websites. Effortlessly connect your datasets or gather user input to display real-time counters and progress bars, ensuring your audience is always up-to-date with the latest information. The app offers full customization, allowing you to adjust colors and values so your visuals seamlessly align with your website's design. To see your personalized changes in action, simply publish or preview your site. Featuring engaging pre-set animations, StatTrack ensures that key metrics capture your visitors' attention, making data highlights both informative and captivating. With its user-friendly setup that requires no coding, StatTrack enables anyone to configure and personalize their data displays efficiently. From tracking sales and monitoring project milestones to countdowns for events, StatTrack provides a versatile and visually appealing solution to enhance the interactivity of any website.
Scroll to Top