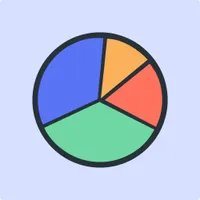
Easily Add a Pie Chart on your Site
- Effortless Configuration and Customization: Quickly create a visually appealing pie chart with our intuitive setup. Easily define partition data, set labels that appear on hover, and adjust chart size to fit your site's design. Personalize your chart with optional images in partitions, ensuring it aligns perfectly with your site's aesthetic
- Dynamic Legend and Hover Labels: Improve data comprehension with a dynamic legend displayed below the chart and partition labels that appear on mouse hover. These features help visitors understand your data effortlessly, making the pie chart a valuable tool for presenting complex information in a digestible format
- Responsive Design for Mobile and Desktop: Ensure a seamless user experience across devices by configuring different views for mobile and desktop. The pie chart's size and appearance are easily adjustable, offering a fully responsive solution that maintains clarity and functionality regardless of screen size
- Advanced Data Integration and Velo Support: Unlock the full potential of your pie chart by connecting it to an API or using Velo to set the data programmatically. This advanced feature allows developers to dynamically update chart data, making the widget perfect for displaying real-time analytics, market trends, or user-generated content
Enhance your website with our versatile "Pie Chart" widget, designed to visually showcase data in a clear and engaging way. Easily configure partition data, set hover labels for each section, and adjust the chart size to fit seamlessly with your site's design. Customize your chart further by adding images to partitions and displaying a dynamic legend beneath the chart, ensuring your data is easy to understand.
Responsive design ensures a consistent and attractive appearance across devices, with customizable views for mobile and desktop. The widget provides effortless configuration, enabling you to personalize every detail, from partition labels to overall size and styling.
For advanced users, the widget offers powerful integration capabilities. Connect your pie chart to an API or use Velo to dynamically set the data, perfect for real-time analytics or personalized user-generated content.
Whether you need a simple data visualization tool or a fully interactive chart with advanced customization, the "Pie Chart" widget is the perfect solution to transform your data into an impactful visual story.
