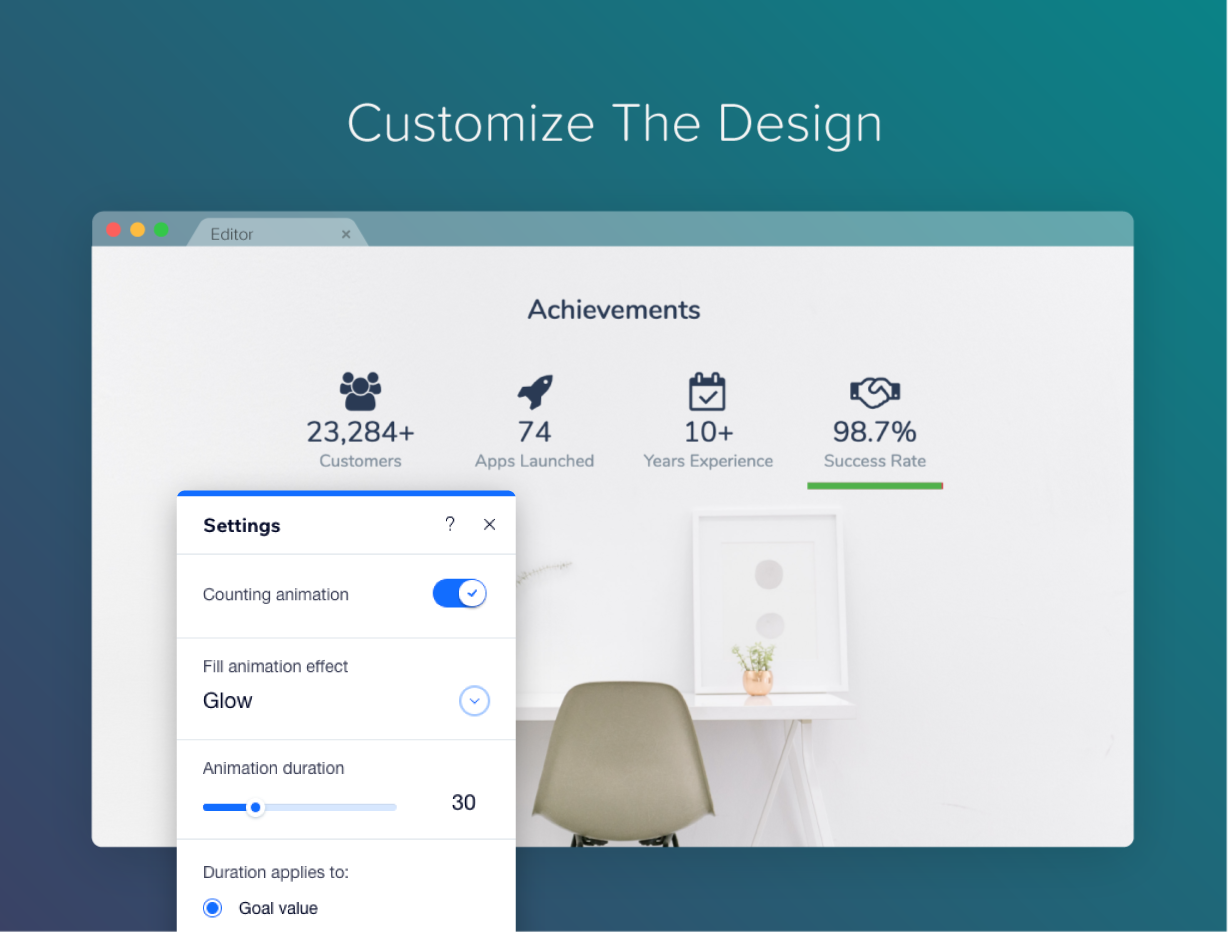
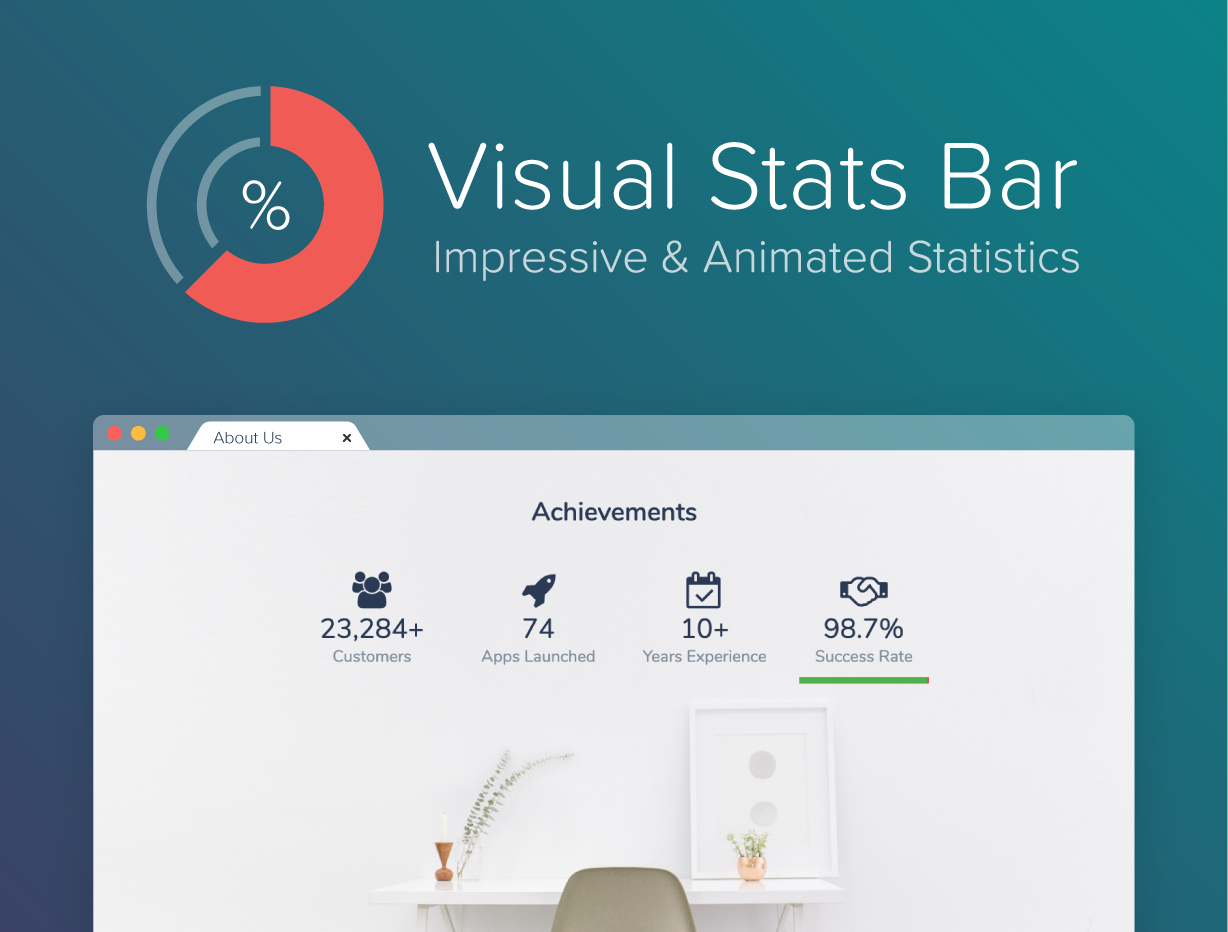
Show stats & achievements with animated graphs
- Smooth number & graph animations
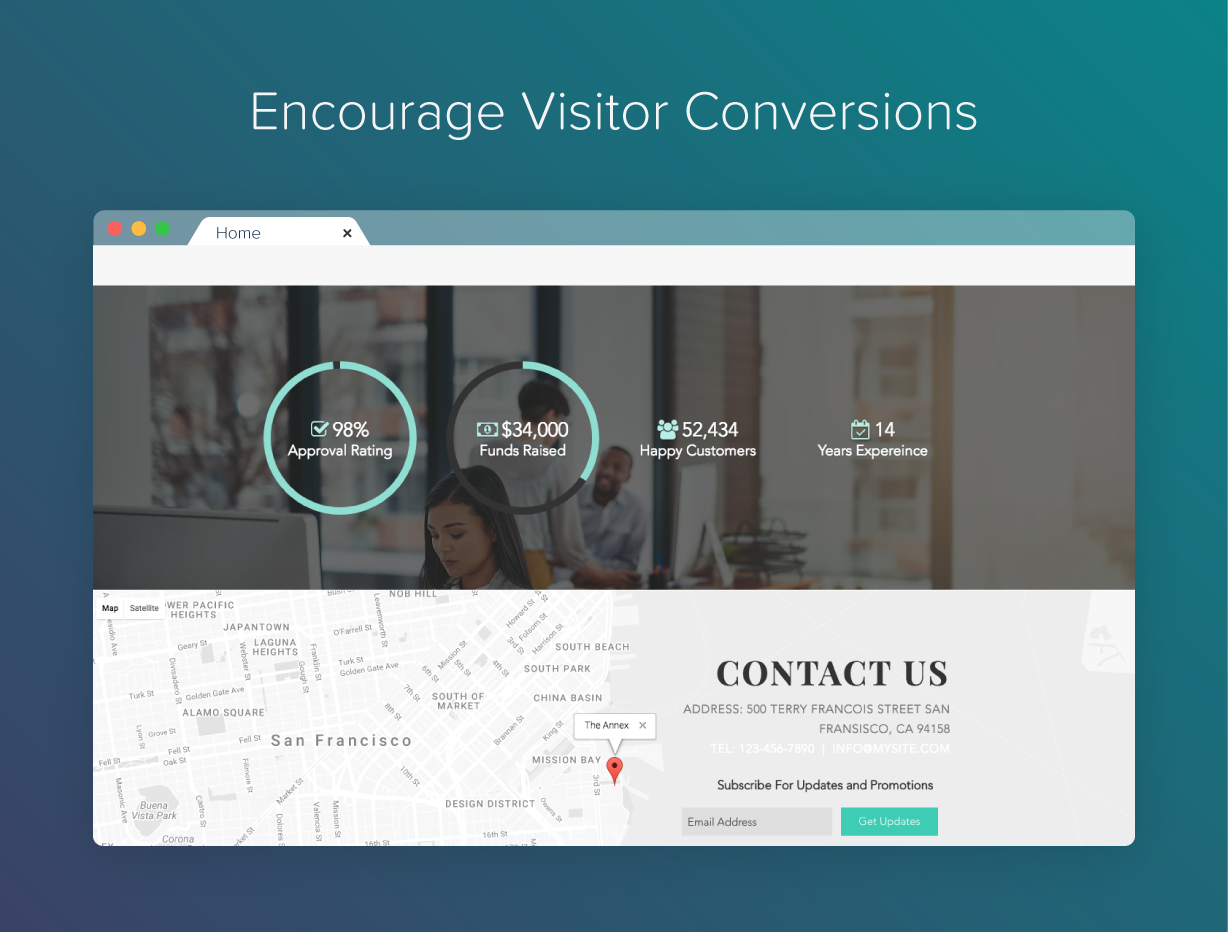
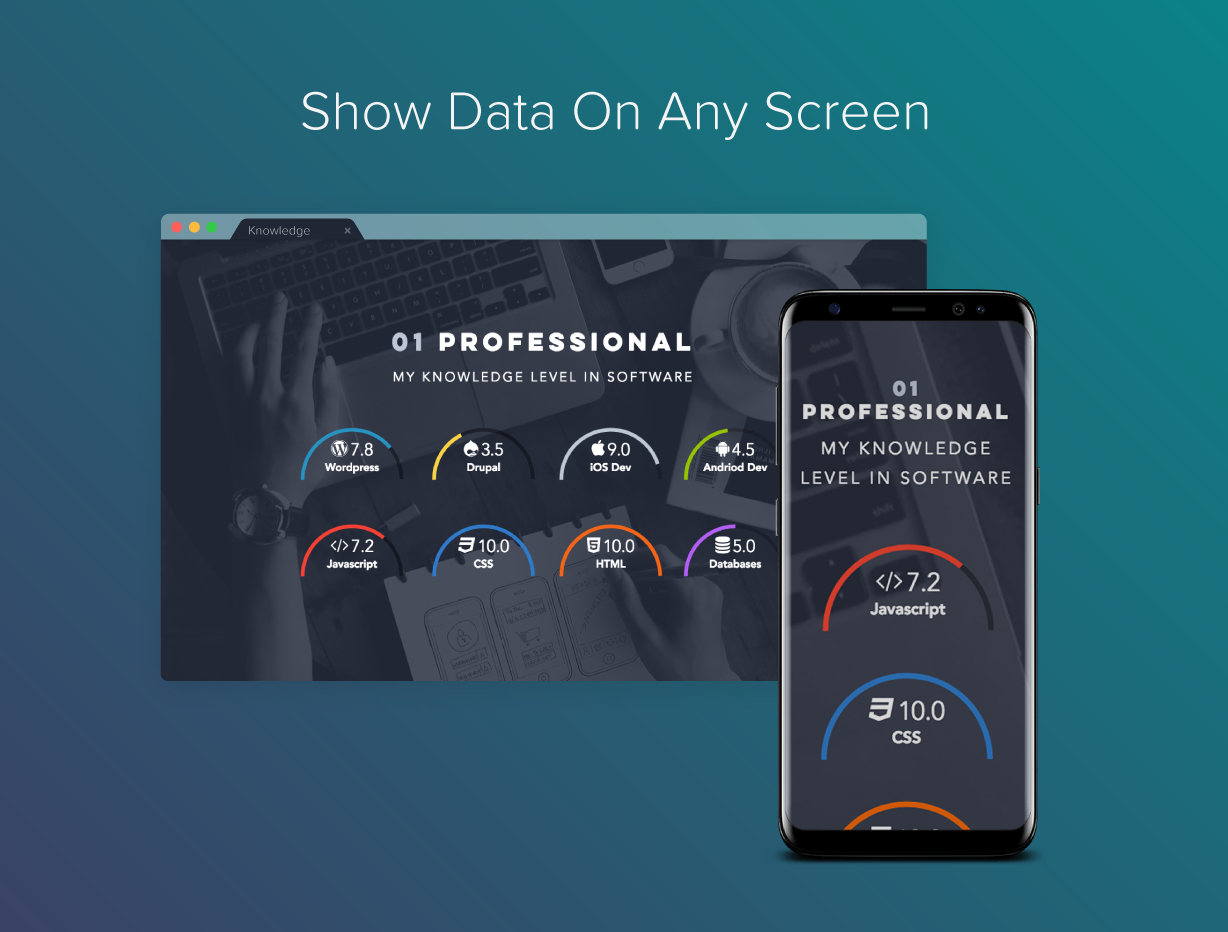
- Choose from 7 customizable layouts
- Connect with Collections or Google Sheets to show live data
- Easy Setup
Make an impact with a visual bar graph on your website. These graphs are a professional way to show off your stats, progress, or achievements. Customize each individually for anything like sales, fundraising goals, portfolios, and more. Pick from 7 designs, add a current value, a goal value, and you're set. Optionally use a Google spreadsheet to show current live values each time someone visits the page.